| Fire incidents reported |
|---|
| Sreet name | Count |
|---|
| HWY 25 | 78 | | SHUN PIKE | 44 | | HWY 76 | 28 | | HIGHWAY 25 | 24 | | UPPER STATION CAMP CREEK RD | 20 | | NEW DEAL POTTS RD | 18 | | HIGHWAY 31W | 16 | | FRANKLIN RD | 14 | | BUGG HOLLOW RD | 12 | | GARRISON BRANCH RD | 12 | | HALLTOWN RD | 12 | | WEEPING WILLOW RD | 12 | | COUNTY HOUSE RD | 10 | | HIGHWAY 76E | 10 | | BOWLING BRANCH RD | 8 | | BURSBY BRANCH RD | 8 | | HWY 31W HWY | 8 | | MAXWELL BRANCH RD | 8 | | BELCHER HOLLOW RD | 6 | | CREEKMORE RD | 6 | | CUMMINGS LN | 6 | | HWY 31 W | 6 | | LEE RD | 6 | | MAXWELL BRANCH | 6 | | PEE DEE BRANCH RD | 6 |
| | | Fire incidents reported |
|---|
| Sreet name | Count |
|---|
| SOUTH RD | 6 | | TYLER CT | 6 | | WALKER RD | 6 | | BEN ALBERT RD | 4 | | BIGGS RD | 4 | | BURSBY BRANCH | 4 | | DUSTY LANE | 4 | | HIDDEN MEADOWS DR | 4 | | HIGHWAY 31 | 4 | | HOOD RD | 4 | | HWY 76W | 4 | | HWY76 | 4 | | JAKE LINK RD | 4 | | LIBERTY LN | 4 | | SHUN PIKE | 4 | | TOM LINK RD | 4 | | UPPER STATION CAMP CREEK RD | 4 | | WILKINSON RD | 4 | | 1860 GARRISON BRANCH RD | 2 | | 3172 HWY 76 | 2 | | 501A FRANKLIN RD | 2 | | ADAMS DR | 2 | | ARNETTY DR | 2 | | BUG HOLLOW RD | 2 | | BUG HOLLOW RD | 2 |
|
 According to the data from the years 2002 - 2018 the average number of fire incidents per year is 17. The highest number of reported fires - 31 took place in 2004, and the least - 6 in 2015. The data has a decreasing trend.
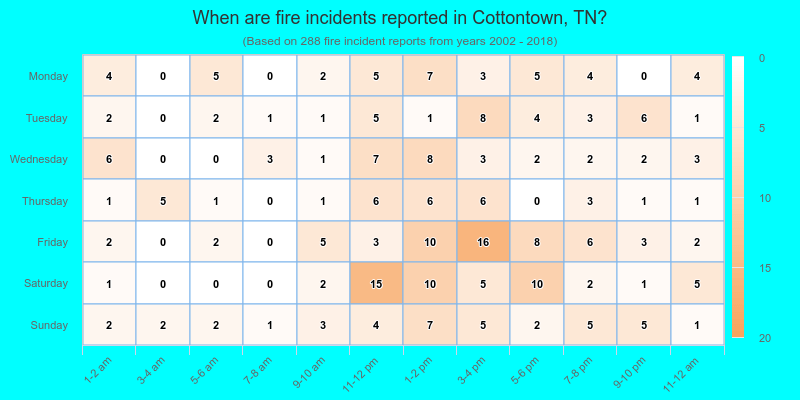
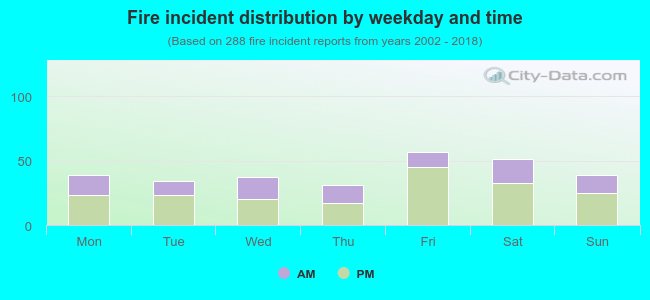 35.4% incidents where reported in the morning and 64.6% in the evening. The most fires (19.8%) took place on Friday, and the least (10.8%) on Thursday.
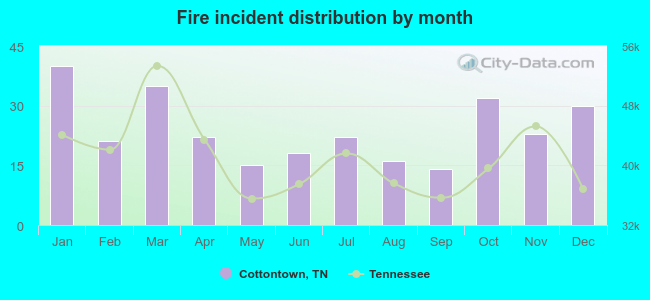 According to the 288 reports from years 2002 - 2018 most fires (13.9%) took place during January, and the least (4.9%) in September.
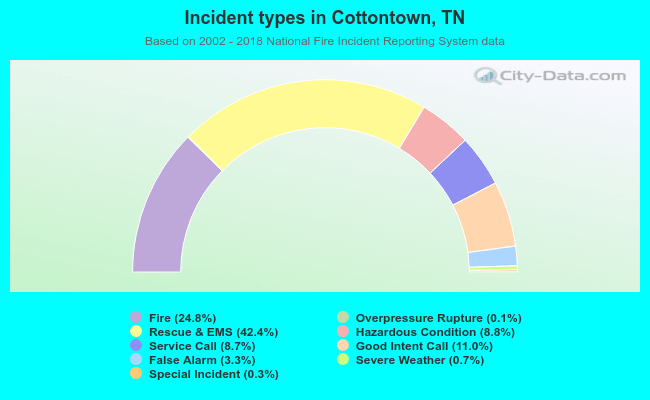 Out of all 1,163 cases reported during the years 2002 - 2018, the most belonged to the categories: Rescue & EMS (42.4%), Fire (24.8%), and Good Intent Call (11.0%).
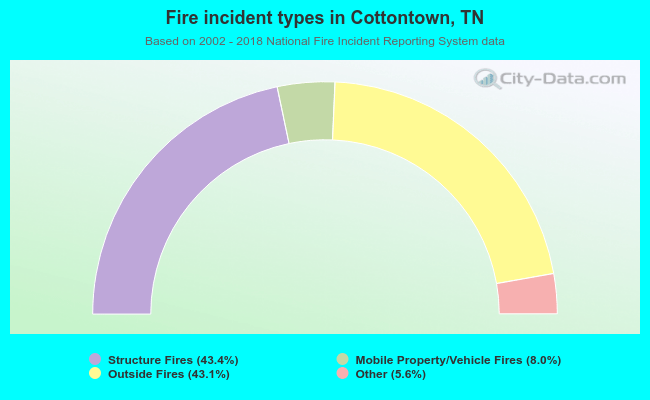 When looking into fire subcategories, the most incidents belonged to: Structure Fires (43.4%), and Outside Fires (43.1%).