| Fire incidents reported |
|---|
| Sreet name | Count |
|---|
| COTTONWOOD RD | 126 | | METCALF ST | 62 | | GENE TERRY RD | 58 | | STATELINE RD | 56 | | DYRAS RD | 51 | | COUNTY 55 RD | 50 | | GROVE ST | 49 | | FLETCHER SMITH RD | 38 | | NOBLES RD | 38 | | HICKORY GROVE RD | 32 | | GRANGER ST | 29 | | HOUSTON ST | 29 | | MCCOY RD | 29 | | WILLIE VARNUM RD | 29 | | CO. 55 RD | 21 | | BUD MOORE RD | 15 | | D HODGE RD | 15 | | EDWIN REYNOLDS RD | 15 | | PHILLIPS RD | 15 | | TRAPPER RIDGE RD | 15 | | ACORN VALLEY CIR | 14 | | CB BARN RD | 14 | | MT. ZION RD | 14 | | BURL LEE RD | 13 | | D. HODGE RD | 13 |
| | | Fire incidents reported |
|---|
| Sreet name | Count |
|---|
| DECATUR RD | 13 | | SEALY WELLS RD | 13 | | BUNTIN RD | 10 | | CORNFIELD LN | 10 | | COUNTY 33 RD | 10 | | GRANGER RD | 10 | | JOHNSON ST | 10 | | KIMBLE RD | 10 | | LEWIS ST | 10 | | MCCOY RD | 10 | | PRISTINE CT | 10 | | REDWING RD | 10 | | ST MARY RD | 10 | | ST. MARY RD | 10 | | US 231 HWY | 10 | | HARDEN RD | 8 | | ROCKY CREEK RD | 8 | | STATE LINE RD | 8 | | 10 BUCK CREEK | 5 | | 12657 US 231 SOUTH | 5 | | 15012 US 231 | 5 | | 349 BOAD STREET | 5 | | 35 OATES ROAD | 5 | | 757 GENE TERRY RD | 5 | | 789 HOUSTON ST | 5 |
|
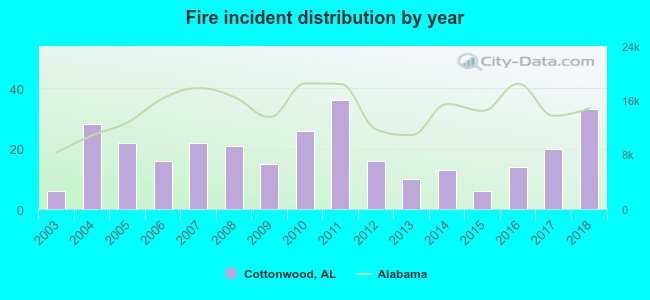 Based on the data from the years 2003 - 2018 the average number of fires per year is 19. The highest number of fire incidents - 36 took place in 2011, and the least - 6 in 2003. The data has a growing trend.
 24.3% incidents where reported in the morning and 75.7% in the evening. The most fires (17.8%) took place on Sunday, and the least (11.2%) on Monday.
 Based on the 304 fire incident reports from years 2003 - 2018 most fires (13.8%) took place during January, and the least (4.3%) in July.
 Out of all 838 cases reported during the years 2003 - 2018, the most belonged to the categories: Fire (36.3%), Rescue & EMS (21.8%), and Hazardous Condition (21.4%).
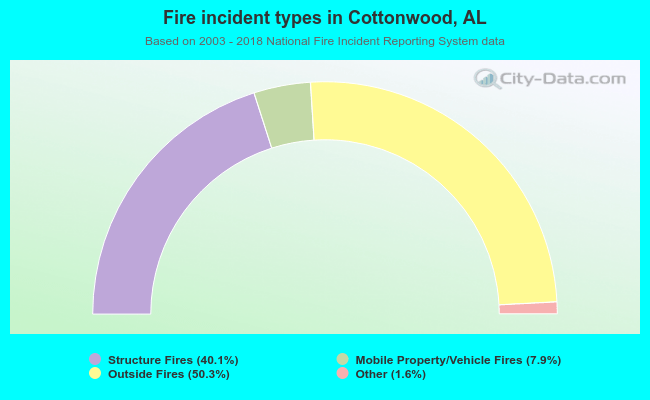 When looking into fire subcategories, the most reports belonged to: Outside Fires (50.3%), and Structure Fires (40.1%).