| Fire incidents reported |
|---|
| Sreet name | Count |
|---|
| EAST RD | 18 | | HWY 95 | 8 | | KEUTERVILLE RD | 8 | | KING STREET | 6 | | 408 2ND ST. SOUTH | 4 | | COTTONWOOD BUTTE RD | 4 | | FOSTER ST | 4 | | FRONT ST. | 4 | | GREENCREEK RD | 4 | | LEWISTON ST | 4 | | MAIN ST | 4 | | SUBSTATION RD | 4 | | US HWY 95 | 4 | | 1008 E. ST. | 2 | | 1106 LEWISTON ST. | 2 | | 1220 EAST ST | 2 | | 1301 SCHOOL ST. | 2 | | 148 FREI LANE | 2 | | 1ST SOUTH | 2 | | 1ST ST | 2 | | 202 MAIN ST | 2 | | 203 A STREET | 2 | | 203 ST. MICHAELS RD | 2 | | 223 EAST ROAD | 2 | | 2ND SOUTH ST | 2 |
| | | Fire incidents reported |
|---|
| Sreet name | Count |
|---|
| 402 BUTLER | 2 | | 405 1ST SREET SOUTH | 2 | | 485 COTTONWOOD BUTTE RD | 2 | | 4TH STREET | 2 | | 502 BUTLER | 2 | | 510 BASH ST. | 2 | | 605 KING ST | 2 | | 609 HOGAN | 2 | | 610 BASH STREET | 2 | | 700 KING ST | 2 | | 785 EAST RD | 2 | | 811 WASHINGTON STREET | 2 | | 903 SMITH STREET | 2 | | AIRPORT | 2 | | CENTER CANYON ROAD RD | 2 | | CLARK ST | 2 | | COTTONWOOD AIRPORT | 2 | | CREA LN | 2 | | EAST 1ST ST | 2 | | EAST RD X AIRPORT RD | 2 | | EAST RD X HWY 95 | 2 | | EAST ST | 2 | | EAST ST | 2 | | FOSTER ST | 2 | | |
|
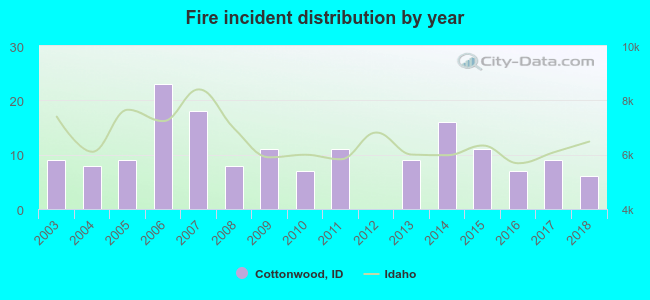 According to the data from the years 2003 - 2018 the average number of fire incidents per year is 10. The highest number of reported fires - 23 took place in 2006, and the least - 0 in 2012. The data has a declining trend.
 33.3% incidents where reported in the morning and 66.7% in the evening. The most fires (21.0%) took place on Tuesday, and the least (8.6%) on Monday.
 Based on the 162 fires from years 2003 - 2018 most fires (17.3%) took place during August, and the least (3.1%) in October.
 Out of all 205 cases reported during the years 2003 - 2018, the most belonged to the categories: Fire (79.0%), Overpressure Rupture (8.8%), and Rescue & EMS (5.4%).
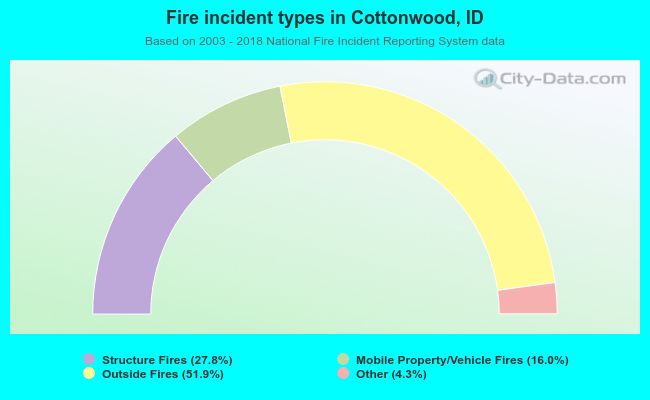 When looking into fire subcategories, the most reports belonged to: Outside Fires (51.9%), and Structure Fires (27.8%).