Council Bluffs: Fire Incidents, Iowa (IA)
Where are fire incidents reported in Council Bluffs, IA
Something went wrong! Please refresh the page.
| Fire incidents reported | |
|---|---|
| Sreet name | Count |
| BROADWAY ST | 184 |
| AV B | 106 |
| AV | 90 |
| AV D | 86 |
| AV A | 76 |
| AV C | 76 |
| I80 | 76 |
| 8 ST | 70 |
| 35 ST | 68 |
| 7 ST | 64 |
| 6 AV | 62 |
| 2 AV | 58 |
| BROADWAY | 58 |
| 1 ST | 52 |
| GREENVIEW RD | 52 |
| 6 ST | 50 |
| 9 AV | 50 |
| AV G | 48 |
| I29 | 46 |
| VETERANS MEMORIAL HY | 46 |
| 5 AV | 44 |
| 4 ST | 42 |
| 21 ST | 36 |
| 9 ST | 36 |
| AV F | 36 |
| NAVAJO ST | 36 |
| RIVER RD | 36 |
| TWIN CITY DR | 36 |
| 24 ST | 34 |
| 25 ST | 34 |
| Other | 1,357 |
2002 - 2017 National Fire Incident Reporting System (NFIRS) incidents
- Incident types reported to NFIRS in Council Bluffs, IA
- 18,43664.2%Rescue & EMS
- 3,14511.0%Fire
- 2,4648.6%Hazardous Condition
- 2,1757.6%Good Intent Call
- 1,4735.1%False Alarm
- 8823.1%Service Call
- 940.3%Special Incident
- 450.2%Overpressure Rupture
- Fire incident types reported to NFIRS in Council Bluffs, IA
- 1,56249.7%Outside Fires
- 86527.5%Structure Fires
- 54617.4%Mobile Property/Vehicle Fires
- 1725.5%Other
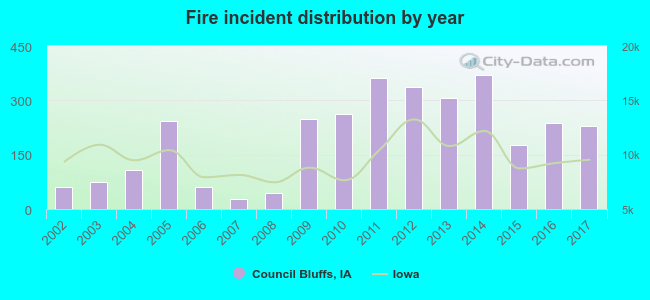 Based on the data from the years 2002 - 2017 the average number of fire incidents per year is 197. The highest number of reported fire incidents - 369 took place in 2014, and the least - 28 in 2007. The data has a rising trend.
The average number of yearly fire incidents per 10k residents in Council Bluffs, IA compared to nearest cities:
(Note: Based on data for the last 3 years, including only cities with population 5,000 and above)
| Council Bluffs: | 37.4 |
| Glenwood: | 56.6 |
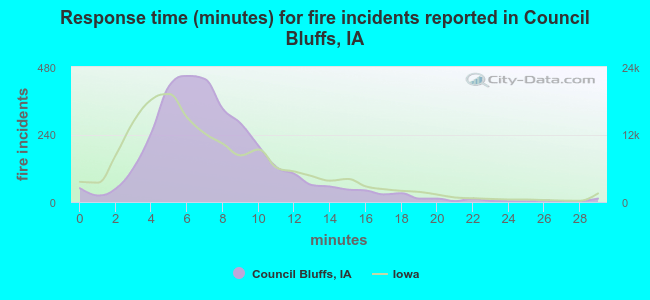 The median response time based on all reported fire incidents is 7 minutes. This is comparable to the Iowa median value.
The median response time in Council Bluffs, IA compared to nearest cities:
(Note: Based on data for all years, including only cities with at least 500 fire incidents)
| Council Bluffs: | 7 minutes |
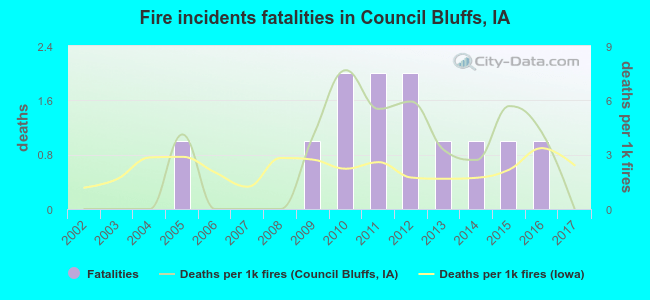 Based on the data from the years 2002 - 2017 the average number of fire-related yearly deaths is 1. The highest number of deaths - 2 took place in 2010, and the lowest - 0 in 2002. The data has a constant trend.
The average number of fatalities per 1,000 fires is 3. This indicator was the highest - 8 in 2010, and the lowest 0 in 2002. The trend for deaths per 1,000 fire incidents is increasing. Compared to the state value the number of fatalities per 1,000 incidents is higher.
Based on the data from the years 2002 - 2017 the average number of fire-related yearly deaths is 1. The highest number of deaths - 2 took place in 2010, and the lowest - 0 in 2002. The data has a constant trend.
The average number of fatalities per 1,000 fires is 3. This indicator was the highest - 8 in 2010, and the lowest 0 in 2002. The trend for deaths per 1,000 fire incidents is increasing. Compared to the state value the number of fatalities per 1,000 incidents is higher.Deaths per 1,000 incidents in Council Bluffs, IA compared to nearest cities:
(Note: Based on data for all years, including only cities with at least 2,500 fire incidents)
| Council Bluffs: | 3.8 |
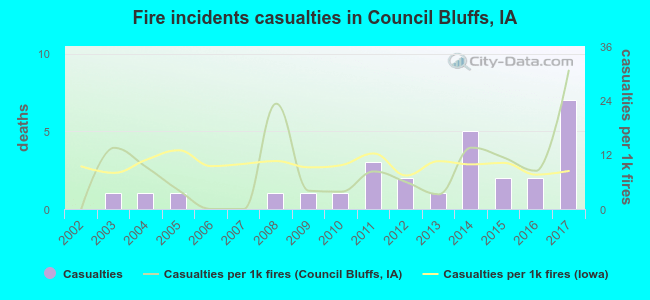 Based on the reports from the years 2002 - 2017 the average number of fire-related yearly casualties is 2. The highest number of reported casualties - 7 took place in 2017, and the lowest - 0 in 2002. The data has an increasing trend.
The average number of casualties per 1,000 fire incidents is 9. This indicator was the highest - 31 in 2017, and the lowest 0 in 2002. The trend for casualties per 1,000 fires is rising. Compared to the state value the number of injuries per 1,000 incidents is similar.
Based on the reports from the years 2002 - 2017 the average number of fire-related yearly casualties is 2. The highest number of reported casualties - 7 took place in 2017, and the lowest - 0 in 2002. The data has an increasing trend.
The average number of casualties per 1,000 fire incidents is 9. This indicator was the highest - 31 in 2017, and the lowest 0 in 2002. The trend for casualties per 1,000 fires is rising. Compared to the state value the number of injuries per 1,000 incidents is similar.Casualties per 1,000 incidents in Council Bluffs, IA compared to nearest cities:
(Note: Based on data for all years, including only cities with at least 500 fire incidents)
| Council Bluffs: | 8.9 |
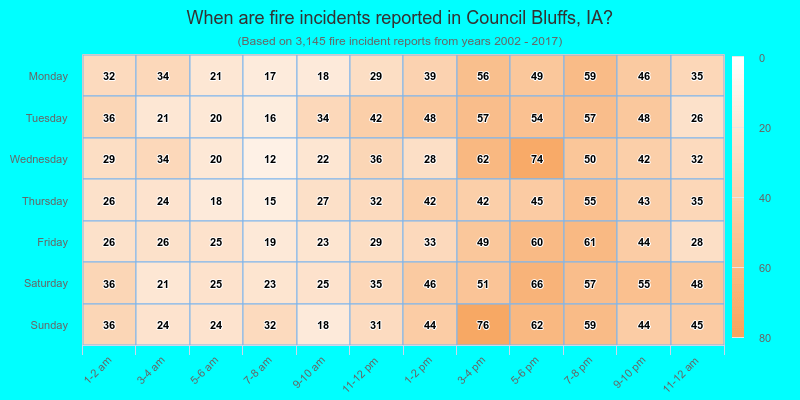
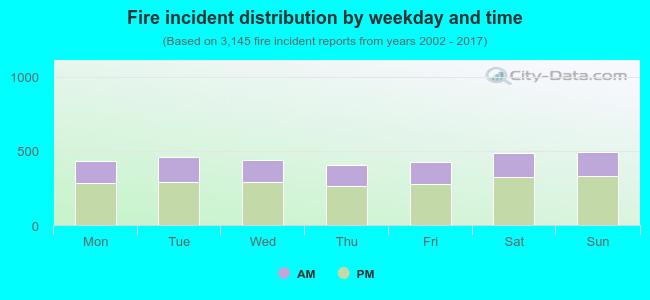 34.8% incidents where reported in the morning and 65.2% in the evening. The most fires (15.7%) took place on Sunday, and the least (12.8%) on Thursday.
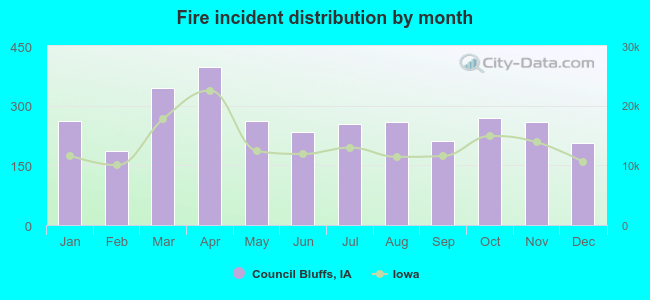 Based on the 3,145 reports from years 2002 - 2017 most fires (12.6%) took place during April, and the least (5.9%) in February.
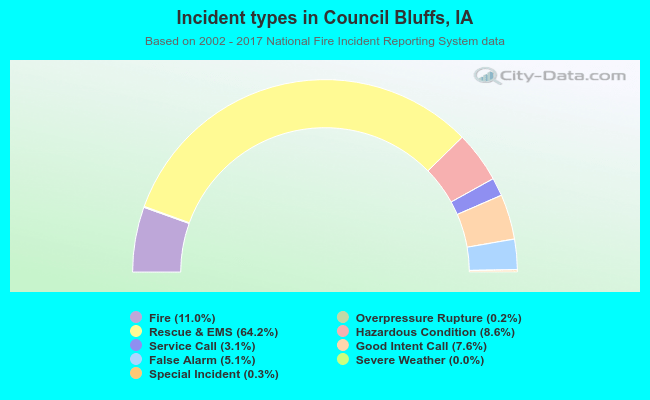 Out of all 28,715 cases reported during the years 2002 - 2017, the most belonged to the categories: Rescue & EMS (64.2%), Fire (11.0%), and Hazardous Condition (8.6%).
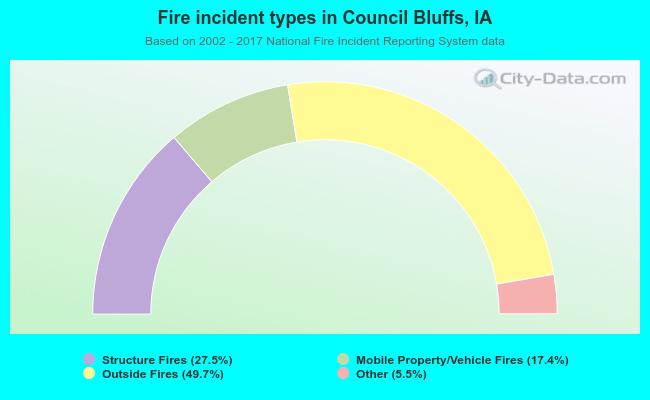 When looking into fire subcategories, the most incidents belonged to: Outside Fires (49.7%), and Structure Fires (27.5%).