| Fire incidents reported |
|---|
| Sreet name | Count |
|---|
| MINA RD | 50 | | 162 HWY | 26 | | MINA RD. | 20 | | AGENCY RD | 8 | | HIGHWAY 162 HWY | 8 | | HOPPER LN | 8 | | HWY 162 | 8 | | MENDOCINO PASS RD | 8 | | ZENIA RD | 8 | | AIRPORT RD | 6 | | POONKINNEY RD | 6 | | REFUSE RD | 6 | | REFUSE RD | 6 | | CAMNF1446 | 4 | | COVELO RD | 4 | | FOOTHILL BLVD | 4 | | HIGHWAY 162 | 4 | | HULLS VALLEY RD | 4 | | HWY 162 HWY | 4 | | MENDOCINO PASS RD RD | 4 | | MENDOCINO PASS ROAD | 4 | | RIFLE RANGE RD | 4 | | #2 CONCOW | 2 | | 24720 FAIRBANKS | 2 | | 2496 EAST LANE | 2 |
| | | Fire incidents reported |
|---|
| Sreet name | Count |
|---|
| AGENCY | 2 | | AIRPORT | 2 | | ASA BEAN RD | 2 | | BENTLEY RIDGE ROAD RD | 2 | | BIGGAR LN | 2 | | CONCOW | 2 | | CONCOW BLVD | 2 | | CONCOW BLVD | 2 | | COUNTY RD 343 | 2 | | CRAWFORD RD | 2 | | DOS RIOS RD | 2 | | EEL RIVER RANCH RD | 2 | | EEL RIVER RANCH RD RD | 2 | | FOOTHILL RD | 2 | | FOOTHILL ROAD | 2 | | HENDERSON AVE | 2 | | HENDERSON RD | 2 | | HENDERSON ROAD RD | 2 | | HIDDEN OAK PARK COVELO PL | 2 | | HILL RD | 2 | | HILL VALLEY RD | 2 | | HINMAN LN LN | 2 | | HUNTER FIRE - MNF 894 | 2 | | HWY 62 | 2 | | |
|
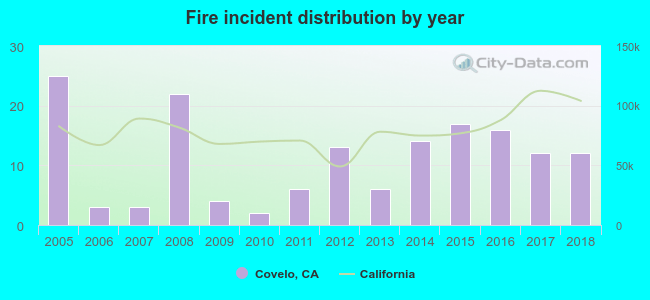 According to the data from the years 2005 - 2018 the average number of fires per year is 11. The highest number of fires - 25 took place in 2005, and the least - 2 in 2010. The data has a decreasing trend.
 44.5% incidents where reported in the morning and 55.5% in the evening. The most fires (20.6%) took place on Sunday, and the least (7.7%) on Thursday.
 Based on the 155 fires from years 2005 - 2018 most fires (29.7%) took place during August, and the least (0.6%) in February.
 Out of all 163 cases reported during the years 2005 - 2018, the most belonged to the categories: Fire (95.1%), Hazardous Condition (1.8%), and Overpressure Rupture (1.2%).
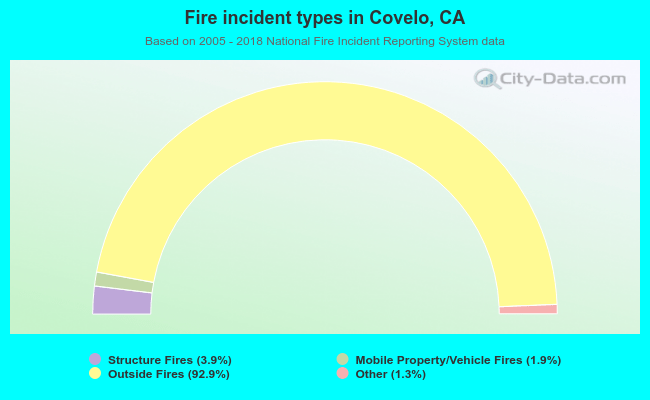 When looking into fire subcategories, the most incidents belonged to: Outside Fires (92.9%), and Structure Fires (3.9%).