Cromwell: Fire Incidents, Indiana (IN)
Where are fire incidents reported in Cromwell, IN
Something went wrong! Please refresh the page.
|
| |||||||||||||||||||||||||||||||||||||||||||||||||||||||||||||||||||||||||||||||||||||||||||||||||||||||||||||
| Other | 75 | |||||||||||||||||||||||||||||||||||||||||||||||||||||||||||||||||||||||||||||||||||||||||||||||||||||||||||||
2002 - 2018 National Fire Incident Reporting System (NFIRS) incidents
- Incident types reported to NFIRS in Cromwell, IN
- 53646.2%Rescue & EMS
- 32127.7%Fire
- 1089.3%Good Intent Call
- 988.4%Hazardous Condition
- 514.4%Service Call
- 242.1%False Alarm
- 141.2%Severe Weather
- 70.6%Special Incident
- Fire incident types reported to NFIRS in Cromwell, IN
- 14645.5%Structure Fires
- 10633.0%Outside Fires
- 3912.1%Mobile Property/Vehicle Fires
- 309.3%Other
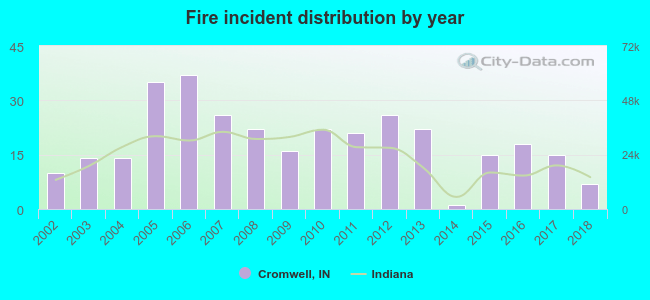 Based on the data from the years 2002 - 2018 the average number of fires per year is 19. The highest number of fire incidents - 37 took place in 2006, and the least - 1 in 2014. The data has a decreasing trend.
 36.1% incidents where reported in the morning and 63.9% in the evening. The most fires (18.4%) took place on Tuesday, and the least (10.6%) on Monday.
 According to the 321 fire incidents from years 2002 - 2018 most fires (11.2%) took place during February, and the least (3.7%) in September.
 Out of all 1,160 cases reported during the years 2002 - 2018, the most belonged to the categories: Rescue & EMS (46.2%), Fire (27.7%), and Good Intent Call (9.3%).
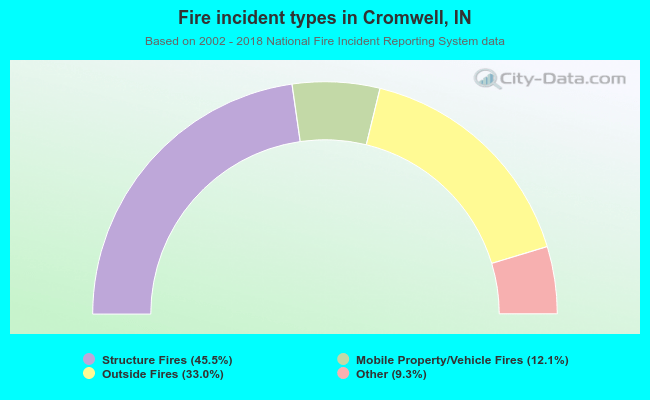 When looking into fire subcategories, the most reports belonged to: Structure Fires (45.5%), and Outside Fires (33.0%).