Cross Lanes: Fire Incidents, West Virginia (WV)
Where are fire incidents reported in Cross Lanes, WV
Something went wrong! Please refresh the page.
| Fire incidents reported | |
|---|---|
| Sreet name | Count |
| BIG TYLER RD | 154 |
| WASHINGTON STREET WEST | 54 |
| ROCKY FORK RD | 50 |
| CROSS LANES DR | 40 |
| BIG TYLER RD | 38 |
| FISHERS BRANCH RD | 34 |
| GOFF MOUNTAIN RD | 34 |
| DALEWOOD DR | 30 |
| CRYSTAL DR | 26 |
| KELLY RD | 24 |
| DREXEL PLACE | 22 |
| FISHERS BRANCH | 22 |
| LAKEVIEW DR | 22 |
| BERRY LANE | 20 |
| WALNUT VALLEY DR | 20 |
| DEWITT RD | 16 |
| I-64 EAST | 16 |
| ROCKY FORK RD | 16 |
| FAIRLAWN AVE | 14 |
| I-64 WEST BOUND | 14 |
| I-64 WEST BOUND LN EXPY | 14 |
| OLD GOFF MOUNTAIN RD | 14 |
| PIONEER DR | 14 |
| BIG TYLER ROAD RD | 12 |
| CARLTON COURT | 12 |
| DOC BAILEY RD | 12 |
| FIRE CREEK RD | 12 |
| GOFF CROSSING DR | 12 |
| I-64 FWY | 12 |
| KENSINGTON DR | 12 |
| Other | 229 |
2003 - 2018 National Fire Incident Reporting System (NFIRS) incidents
- Incident types reported to NFIRS in Cross Lanes, WV
- 1,02131.5%Fire
- 67320.8%Rescue & EMS
- 58918.2%Good Intent Call
- 54916.9%Hazardous Condition
- 1905.9%False Alarm
- 1895.8%Service Call
- 150.5%Special Incident
- 90.3%Severe Weather
- 80.2%Overpressure Rupture
- Fire incident types reported to NFIRS in Cross Lanes, WV
- 47646.6%Structure Fires
- 31230.6%Outside Fires
- 18618.2%Mobile Property/Vehicle Fires
- 474.6%Other
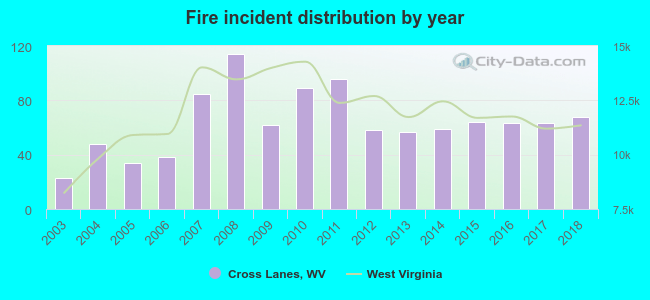 Based on the data from the years 2003 - 2018 the average number of fires per year is 64. The highest number of reported fires - 114 took place in 2008, and the least - 23 in 2003. The data has a growing trend.
The average number of yearly fire incidents per 10k residents in Cross Lanes, WV compared to nearest cities:
(Note: Based on data for the last 3 years, including only cities with population 5,000 and above)
| Cross Lanes: | 64.7 |
| Nitro: | 89.7 |
| Dunbar: | 32.3 |
| South Charleston: | 38.8 |
| Teays Valley: | 4.8 |
| Charleston: | 174.3 |
| Hurricane: | 93.8 |
| Huntington: | 94.2 |
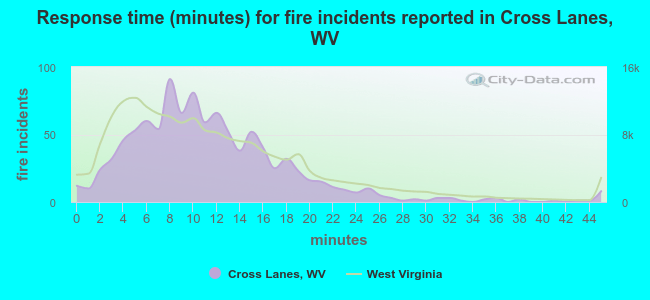 The median response time based on all reported fire incidents is 10 minutes. This is close to the West Virginia median value.
The median response time in Cross Lanes, WV compared to nearest cities:
(Note: Based on data for all years, including only cities with at least 500 fire incidents)
| Cross Lanes: | 10 minutes |
| Poca: | 10 minutes |
| Nitro: | 5 minutes |
| St. Albans: | 7 minutes |
| South Charleston: | 5 minutes |
| Sissonville: | 15 minutes |
| Charleston: | 6 minutes |
| Hurricane: | 11 minutes |
| Elkview: | 15 minutes |
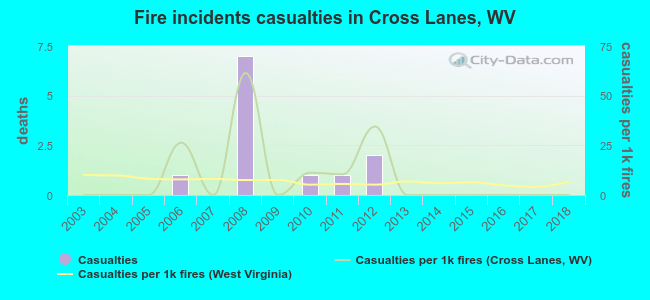 According to the reports from the years 2003 - 2018 the average number of fire-related yearly casualties is 1. The highest number of casualties - 7 took place in 2008, and the lowest - 0 in 2003. The data has a constant trend.
The average number of casualties per 1,000 fire incidents is 9. This indicator was the highest - 61 in 2008, and the lowest 0 in 2003. The trend for injuries per 1,000 incidents is increasing. Compared to the West Virginia value the number of injuries per 1,000 fires is higher.
According to the reports from the years 2003 - 2018 the average number of fire-related yearly casualties is 1. The highest number of casualties - 7 took place in 2008, and the lowest - 0 in 2003. The data has a constant trend.
The average number of casualties per 1,000 fire incidents is 9. This indicator was the highest - 61 in 2008, and the lowest 0 in 2003. The trend for injuries per 1,000 incidents is increasing. Compared to the West Virginia value the number of injuries per 1,000 fires is higher.Casualties per 1,000 incidents in Cross Lanes, WV compared to nearest cities:
(Note: Based on data for all years, including only cities with at least 500 fire incidents)
| Cross Lanes: | 11.8 |
| Poca: | 1.4 |
| Nitro: | 5.8 |
| St. Albans: | 6.7 |
| South Charleston: | 7.7 |
| Sissonville: | 1.2 |
| Charleston: | 5.2 |
| Hurricane: | 7.2 |
| Elkview: | 1.6 |
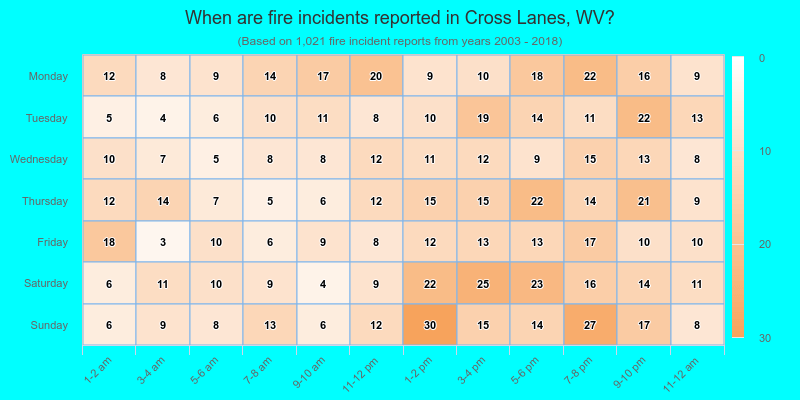
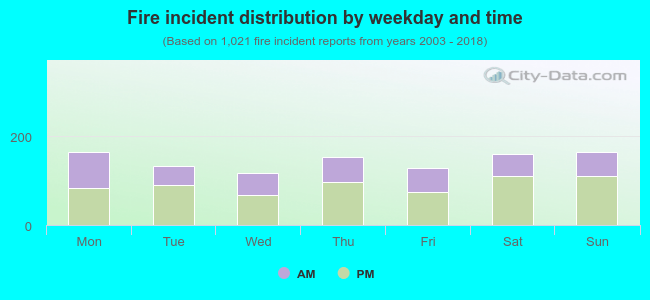 37.9% incidents where reported in the morning and 62.1% in the evening. The most fires (16.2%) took place on Sunday, and the least (11.6%) on Wednesday.
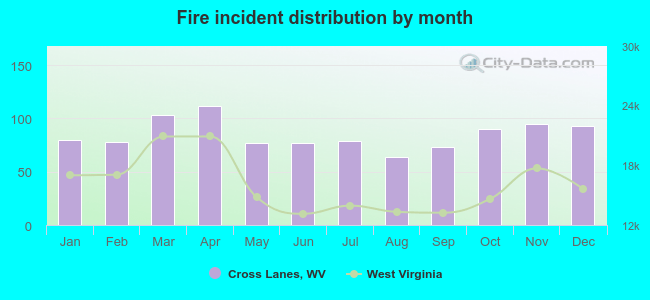 According to the 1,021 reports from years 2003 - 2018 most fires (11.0%) took place during April, and the least (6.3%) in August.
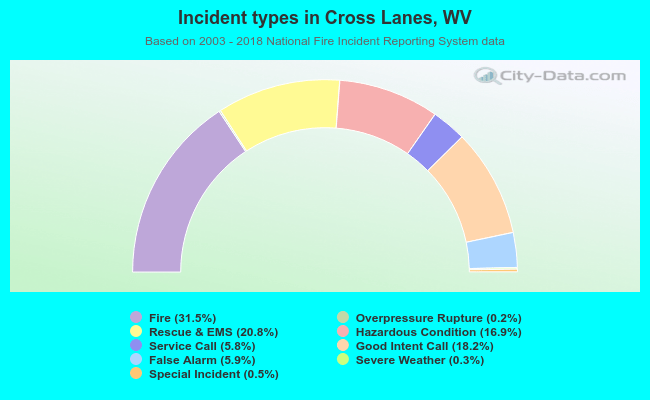 Out of all 3,243 cases reported during the years 2003 - 2018, the most belonged to the categories: Fire (31.5%), Rescue & EMS (20.8%), and Good Intent Call (18.2%).
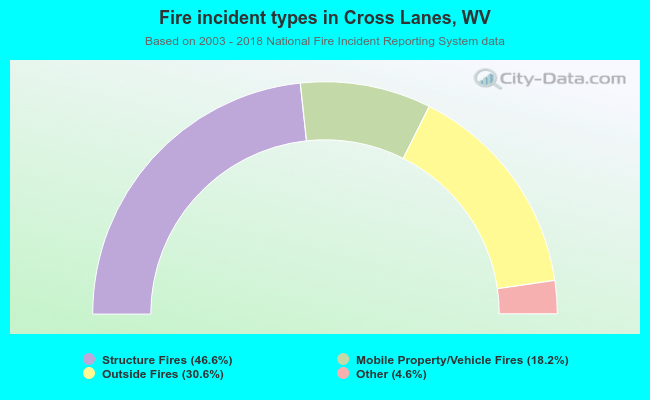 When looking into fire subcategories, the most incidents belonged to: Structure Fires (46.6%), and Outside Fires (30.6%).