Cross Plains: Fire Incidents, Texas (TX)
Where are fire incidents reported in Cross Plains, TX
Something went wrong! Please refresh the page.
|
| |||||||||||||||||||||||||||||||||||||||||||||||||||||||||||||||||||||||||||||||||||||||||||||||||||||||||||||
| Other | 9 | |||||||||||||||||||||||||||||||||||||||||||||||||||||||||||||||||||||||||||||||||||||||||||||||||||||||||||||
2005 - 2018 National Fire Incident Reporting System (NFIRS) incidents
- Incident types reported to NFIRS in Cross Plains, TX
- 19972.9%Fire
- 3813.9%Rescue & EMS
- 165.9%Hazardous Condition
- 103.7%Good Intent Call
- 62.2%Service Call
- 20.7%False Alarm
- 20.7%Severe Weather
- Fire incident types reported to NFIRS in Cross Plains, TX
- 15276.4%Outside Fires
- 2613.1%Structure Fires
- 115.5%Mobile Property/Vehicle Fires
- 105.0%Other
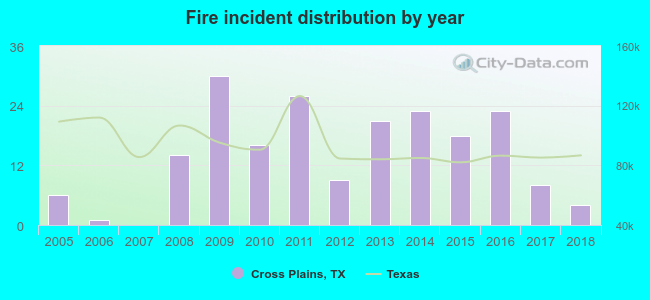 According to the data from the years 2005 - 2018 the average number of fire incidents per year is 14. The highest number of reported fire incidents - 30 took place in 2009, and the least - 0 in 2007. The data has a declining trend.
 21.1% incidents where reported in the morning and 78.9% in the evening. The most fires (17.6%) took place on Saturday, and the least (10.1%) on Thursday.
 According to the 199 fires from years 2005 - 2018 most fires (12.6%) took place during April, and the least (3.5%) in November.
 Out of all 273 cases reported during the years 2005 - 2018, the most belonged to the categories: Fire (72.9%), Overpressure Rupture (13.9%), and Rescue & EMS (5.9%).
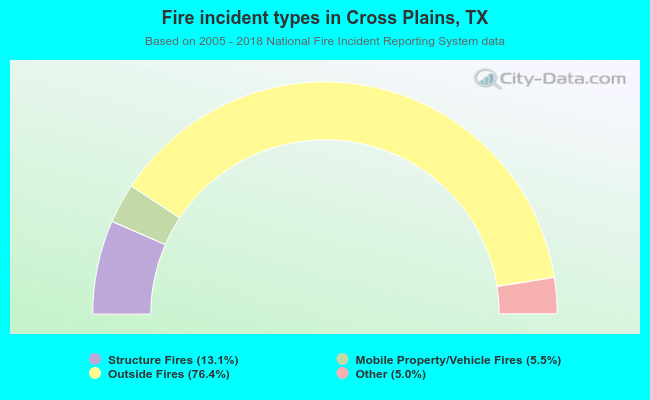 When looking into fire subcategories, the most incidents belonged to: Outside Fires (76.4%), and Structure Fires (13.1%).