Croswell: Fire Incidents, Michigan (MI)
Where are fire incidents reported in Croswell, MI
Something went wrong! Please refresh the page.
|
| |||||||||||||||||||||||||||||||||||||||||||||||||||||||||||||||||||||||||||||||||||||||||||||||||||||||||||||
| Other | 30 | |||||||||||||||||||||||||||||||||||||||||||||||||||||||||||||||||||||||||||||||||||||||||||||||||||||||||||||
2002 - 2018 National Fire Incident Reporting System (NFIRS) incidents
- Incident types reported to NFIRS in Croswell, MI
- 28039.7%Fire
- 16924.0%Rescue & EMS
- 16423.3%Hazardous Condition
- 385.4%Service Call
- 314.4%Good Intent Call
- 202.8%False Alarm
- 20.3%Severe Weather
- 10.1%Special Incident
- Fire incident types reported to NFIRS in Croswell, MI
- 14551.8%Structure Fires
- 7426.4%Outside Fires
- 4616.4%Mobile Property/Vehicle Fires
- 155.4%Other
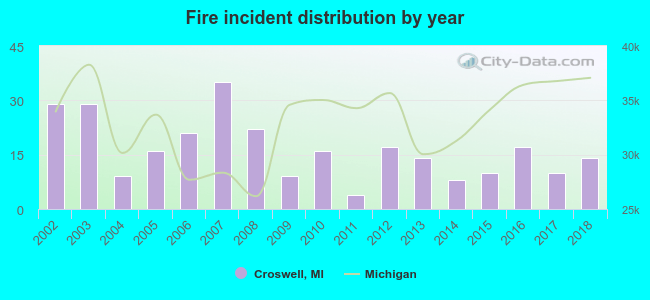 According to the data from the years 2002 - 2018 the average number of fire incidents per year is 16. The highest number of fires - 35 took place in 2007, and the least - 4 in 2011. The data has a dropping trend.
 31.8% incidents where reported in the morning and 68.2% in the evening. The most fires (19.3%) took place on Saturday, and the least (10.4%) on Sunday.
 According to the 280 incident reports from years 2002 - 2018 most fires (12.1%) took place during April, and the least (3.6%) in November.
 Out of all 705 cases reported during the years 2002 - 2018, the most belonged to the categories: Fire (39.7%), Overpressure Rupture (24.0%), and Rescue & EMS (23.3%).
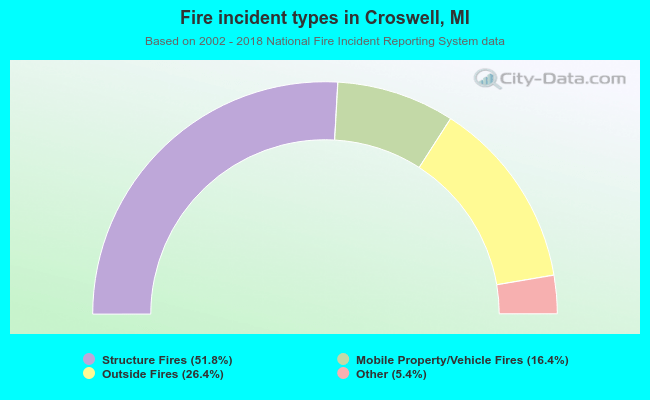 When looking into fire subcategories, the most incidents belonged to: Structure Fires (51.8%), and Outside Fires (26.4%).