| Fire incidents reported |
|---|
| Sreet name | Count |
|---|
| SCRIBNERS MILL RD | 38 | | CULLEOKA HWY | 20 | | CULLEOKA HIGHWAY | 14 | | MOORESVILLE PIKE | 14 | | PULASKI HWY | 14 | | MARTIN HOLLOW RD | 12 | | VALLEY CREEK ROAD | 12 | | DODSON GAP ROAD | 10 | | CAMPBELLSVILLE PIKE | 8 | | DUGGER RD | 8 | | HORNE HOLLOW RD | 8 | | INTERSTATE 65 | 8 | | MARTIN HOLLOW ROAD | 8 | | MCKNIGHT RD | 8 | | MCKNIGHT RD | 8 | | MOORESVILLE PIKE | 8 | | SCRIBNERS MILL RD | 8 | | TANYARD HOLLOW RD | 8 | | VALLEY CREEK RD | 8 | | BUCK DANIELS RD | 6 | | BUCK DANIELS ROAD | 6 | | BUD HASKINS RD | 6 | | CAMPBELLSVILLE PIKE | 6 | | CULLEOKA HWY | 6 | | DEPOT ST | 6 |
| | | Fire incidents reported |
|---|
| Sreet name | Count |
|---|
| PULASKI HIGHWAY | 6 | | QUALITY ST | 6 | | SCHOOL ST | 6 | | SCOTT HOLLOW RD | 6 | | SCRIBNER'S MILL ROAD | 6 | | SEAVY HIGHT RD | 6 | | SMISER HICKMAN RD | 6 | | TANYARD HOLLOW ROAD | 6 | | WHITESELL RD | 6 | | BAPTIST CHURCH RD | 4 | | BAPTIST CHURCH ROAD | 4 | | BRYANT STATION RD | 4 | | BUD HASKINS | 4 | | CAMPBELL STATION RD | 4 | | DODSON GAP RD | 4 | | DUGGER ROAD | 4 | | FITZPATRICK RD | 4 | | GRAHAM RD | 4 | | GREENFIELD ESTATES. | 4 | | GREENFIELD RD | 4 | | HWY 50 EAST | 4 | | I-65 @ 36 MM | 4 | | MOORE LN | 4 | | MOORE LN. | 4 | | |
|
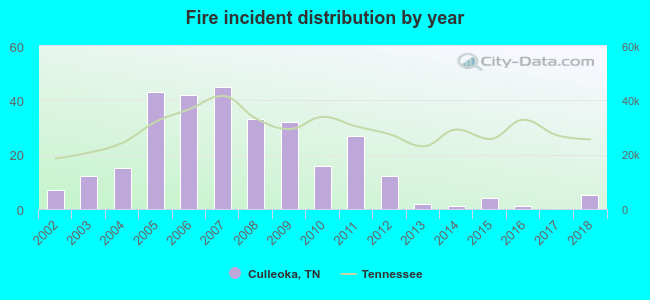 According to the data from the years 2002 - 2018 the average number of fires per year is 17. The highest number of reported fire incidents - 45 took place in 2007, and the least - 0 in 2017. The data has a declining trend.
 According to the reports from the years 2002 - 2018 the average number of fire-related fatalities per year is 0. The highest number of reported deaths - 3 took place in 2003, and the lowest - 0 in 2002. The data has a constant trend.
 36.4% incidents where reported in the morning and 63.6% in the evening. The most fires (21.5%) took place on Sunday, and the least (8.1%) on Thursday.
 Based on the 297 incident reports from years 2002 - 2018 most fires (13.1%) took place during November, and the least (4.4%) in June.
 Out of all 464 cases reported during the years 2002 - 2018, the most belonged to the categories: Fire (64.0%), Rescue & EMS (14.7%), and Good Intent Call (9.9%).
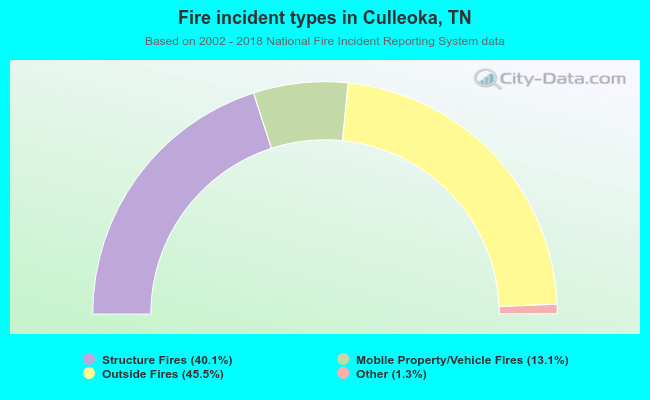 When looking into fire subcategories, the most incidents belonged to: Outside Fires (45.5%), and Structure Fires (40.1%).