| Fire incidents reported |
|---|
| Sreet name | Count |
|---|
| ROUTE 48 | 20 | | RT 48 | 18 | | ROUTE 25 | 16 | | RT 25 | 16 | | COX LANE | 10 | | DEPOT LN | 10 | | OREGON ROAD | 10 | | FLEETWOOD ROAD | 8 | | NASSAU POINT ROAD | 8 | | NEW SUFFOLK AVENUE | 8 | | ALVAH'S LANE | 6 | | ALVAHS LN | 6 | | BRIDGE LANE | 6 | | CORPORATE DRIVE | 6 | | COX LN | 6 | | DEPOT LANE | 6 | | DUCK POND ROAD | 6 | | HARBOR LANE | 6 | | PEQUASH AV | 6 | | SKUNK LANE | 6 | | WUNNEWETA ROAD | 6 | | COUNTY ROUTE 48 | 4 | | DEAN DRIVE | 4 | | EAST RD | 4 | | EAST ROAD | 4 |
| | | Fire incidents reported |
|---|
| Sreet name | Count |
|---|
| HIGHLAND RD | 4 | | NASSAU POINT RD | 4 | | NEW SUFFOLK RD | 4 | | NEW SUFFOLK ROAD | 4 | | PEQUASH AVE | 4 | | RT48 | 4 | | STATE ROUTE 25 | 4 | | STERLING LANE | 4 | | STILLWATER AVE | 4 | | BAYBERRY | 2 | | BEEBE DRIVE | 2 | | BETTS | 2 | | BROADWATERS ROAD | 2 | | CHURCH LANE | 2 | | COMMERAC E DR | 2 | | COMMERACE | 2 | | COMMERACE DR | 2 | | COMMERCE DR & DEPOT LA | 2 | | COMMERCE DRIVE | 2 | | COUNTRY CLUB DRIVE | 2 | | COX LANE | 2 | | COX LANE | 2 | | CR 48 | 2 | | CROWN LAND LN | 2 | | DEAN DR | 2 |
|
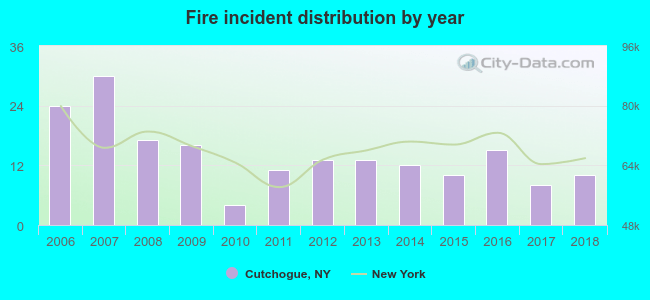 According to the data from the years 2006 - 2018 the average number of fire incidents per year is 14. The highest number of fires - 30 took place in 2007, and the least - 4 in 2010. The data has a decreasing trend.
 33.9% incidents where reported in the morning and 66.1% in the evening. The most fires (16.9%) took place on Monday, and the least (10.4%) on Thursday.
 Based on the 183 reports from years 2006 - 2018 most fires (12.0%) took place during January, and the least (4.9%) in September.
 Out of all 1,772 cases reported during the years 2006 - 2018, the most belonged to the categories: Rescue & EMS (65.7%), False Alarm (12.6%), and Fire (10.3%).
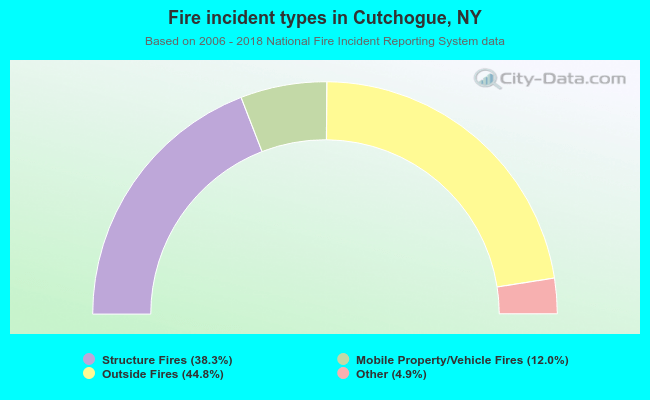 When looking into fire subcategories, the most incidents belonged to: Outside Fires (44.8%), and Structure Fires (38.3%).