Cuthbert: Fire Incidents, Georgia (GA)
Where are fire incidents reported in Cuthbert, GA
Something went wrong! Please refresh the page.
|
| |||||||||||||||||||||||||||||||||||||||||||||||||||||||||||||||||||||||||||||||||||||||||||||||||||||||||||||
2004 - 2018 National Fire Incident Reporting System (NFIRS) incidents
- Incident types reported to NFIRS in Cuthbert, GA
- 30124.2%Rescue & EMS
- 29723.8%Fire
- 19215.4%False Alarm
- 18915.2%Hazardous Condition
- 1229.8%Good Intent Call
- 1169.3%Service Call
- 191.5%Severe Weather
- 50.4%Overpressure Rupture
- 50.4%Special Incident
- Fire incident types reported to NFIRS in Cuthbert, GA
- 11940.1%Structure Fires
- 10234.3%Outside Fires
- 6120.5%Mobile Property/Vehicle Fires
- 155.1%Other
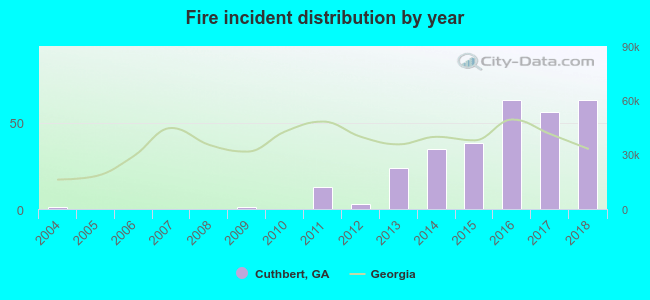 Based on the data from the years 2004 - 2018 the average number of fire incidents per year is 20. The highest number of fire incidents - 63 took place in 2016, and the least - 0 in 2005. The data has an increasing trend.
 Based on the data from the years 2004 - 2018 the average number of fire-related casualties per year is 0. The highest number of reported injuries - 2 took place in 2014, and the lowest - 0 in 2004. The data has a rising trend.
 27.6% incidents where reported in the morning and 72.4% in the evening. The most fires (19.5%) took place on Saturday, and the least (10.8%) on Sunday.
 Based on the 297 reports from years 2004 - 2018 most fires (12.5%) took place during October, and the least (4.4%) in May.
 Out of all 1,246 cases reported during the years 2004 - 2018, the most belonged to the categories: Rescue & EMS (24.2%), Fire (23.8%), and False Alarm (15.4%).
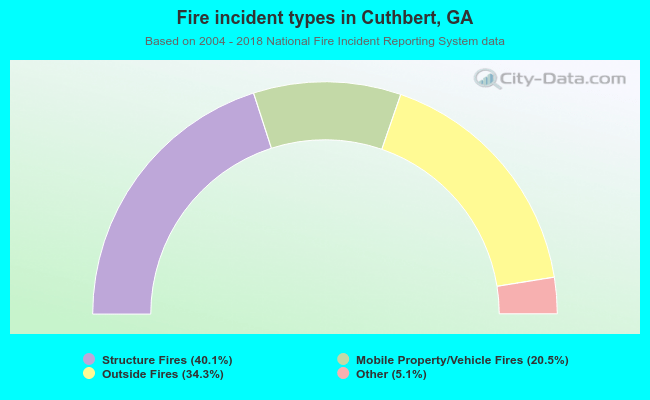 When looking into fire subcategories, the most incidents belonged to: Structure Fires (40.1%), and Outside Fires (34.3%).