Cygnet: Fire Incidents, Ohio (OH)
Where are fire incidents reported in Cygnet, OH
Something went wrong! Please refresh the page.
|
| |||||||||||||||||||||||||||||||||||||||||||||||||||||||||||||||||||||||||||||||||||||||||||||||||||||||||||||
2002 - 2018 National Fire Incident Reporting System (NFIRS) incidents
- Incident types reported to NFIRS in Cygnet, OH
- 29455.2%Rescue & EMS
- 15529.1%Fire
- 315.8%Hazardous Condition
- 295.4%Good Intent Call
- 101.9%Severe Weather
- 81.5%Service Call
- 61.1%False Alarm
- Fire incident types reported to NFIRS in Cygnet, OH
- 6642.6%Outside Fires
- 5334.2%Structure Fires
- 3623.2%Mobile Property/Vehicle Fires
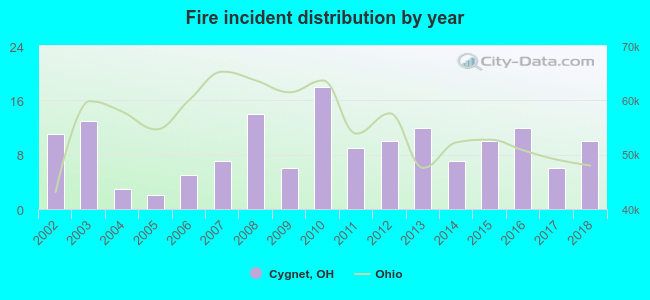 According to the data from the years 2002 - 2018 the average number of fires per year is 9. The highest number of reported fires - 18 took place in 2010, and the least - 2 in 2005. The data has a dropping trend.
 26.5% incidents where reported in the morning and 73.5% in the evening. The most fires (21.3%) took place on Thursday, and the least (8.4%) on Saturday.
 According to the 155 fire incidents from years 2002 - 2018 most fires (12.9%) took place during April, and the least (4.5%) in January.
 Out of all 533 cases reported during the years 2002 - 2018, the most belonged to the categories: Overpressure Rupture (55.2%), Fire (29.1%), and Rescue & EMS (5.8%).
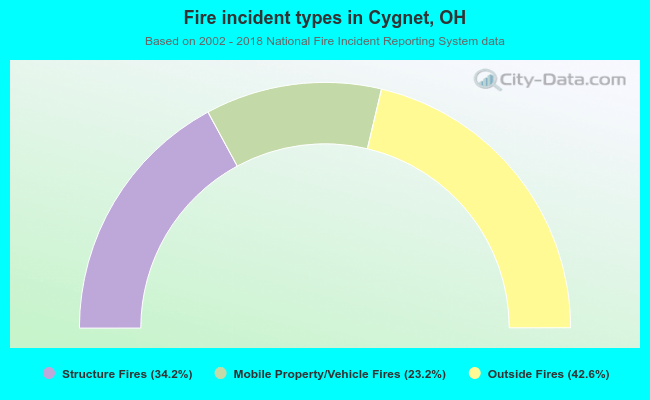 When looking into fire subcategories, the most reports belonged to: Outside Fires (42.6%), and Structure Fires (34.2%).