| Fire incidents reported |
|---|
| Sreet name | Count |
|---|
| BELLE CITY ROAD | 4 | | CR 2025 | 4 | | 100 NORTH | 2 | | 100E | 2 | | 100E AND 2050N | 2 | | 100E AND 2375N | 2 | | 105- 3RD. ST | 2 | | 1350N100E | 2 | | 1375N-200E | 2 | | 1375N150E | 2 | | 14 EAST OF RT 142 AND 200E | 2 | | 1400N250E | 2 | | 142 N DAHLGREN HWY | 2 | | 1600 N500 E | 2 | | 1650 N 525 E | 2 | | 1650N AND 200E | 2 | | 1675 N - 400 E RDS | 2 | | 1675N300E | 2 | | 1700N-0050E RD | 2 | | 1700N0050E | 2 | | 1725 N200 E | 2 | | 1750N AND 150E | 2 | | 1775 N125 E | 2 | | 1830N AND 100E | 2 | | 18348 775 EAST | 2 |
| | | Fire incidents reported |
|---|
| Sreet name | Count |
|---|
| 1850N-300E RDS | 2 | | 1900 N100 E LGTS | 2 | | 1900N AND 425E | 2 | | 1900N-0150E RD | 2 | | 1900N050E | 2 | | 2000N--400E RD | 2 | | 2000N-175E RD | 2 | | 2000N-275E RD | 2 | | 2000N250E | 2 | | 2000N300E | 2 | | 2000N325E LGTS | 2 | | 2000N400E | 2 | | 200E AND 2200N | 2 | | 2100N550E | 2 | | 2125N AND 500E | 2 | | 2175N-0050E RD | 2 | | 2200N175E | 2 | | 2275N-0050E RD | 2 | | 2300N-400E RD | 2 | | 2300N200E | 2 | | 2350 NORTH | 2 | | 2350N AND 100E | 2 | | 2350N AND 500E | 2 | | 2400N | 2 | | |
|
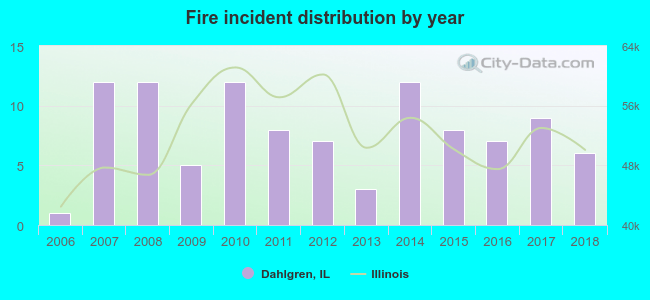 Based on the data from the years 2006 - 2018 the average number of fires per year is 8. The highest number of reported fire incidents - 12 took place in 2007, and the least - 1 in 2006. The data has a rising trend.
 23.5% incidents where reported in the morning and 76.5% in the evening. The most fires (17.6%) took place on Tuesday, and the least (8.8%) on Wednesday.
 Based on the 102 fires from years 2006 - 2018 most fires (20.6%) took place during September, and the least (1.0%) in August.
 Out of all 138 cases reported during the years 2006 - 2018, the most belonged to the categories: Fire (73.9%), Overpressure Rupture (10.9%), and Service Call (5.8%).
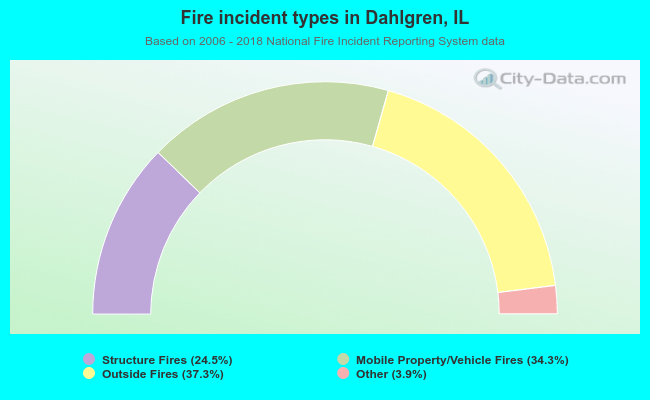 When looking into fire subcategories, the most reports belonged to: Outside Fires (37.3%), and Mobile Property/Vehicle Fires (34.3%).