Danbury: Fire Incidents, Texas (TX)
Where are fire incidents reported in Danbury, TX
Something went wrong! Please refresh the page.
|
| |||||||||||||||||||||||||||||||||||||||||||||||||||||||||||||||||||||||||||||||||||||||||||||||||||||||||||||
| Other | 36 | |||||||||||||||||||||||||||||||||||||||||||||||||||||||||||||||||||||||||||||||||||||||||||||||||||||||||||||
2005 - 2018 National Fire Incident Reporting System (NFIRS) incidents
- Incident types reported to NFIRS in Danbury, TX
- 24850.4%Fire
- 11222.8%Rescue & EMS
- 5912.0%Hazardous Condition
- 285.7%Service Call
- 224.5%Good Intent Call
- 122.4%False Alarm
- 51.0%Severe Weather
- 51.0%Special Incident
- 10.2%Overpressure Rupture
- Fire incident types reported to NFIRS in Danbury, TX
- 15261.3%Outside Fires
- 4919.8%Structure Fires
- 2811.3%Mobile Property/Vehicle Fires
- 197.7%Other
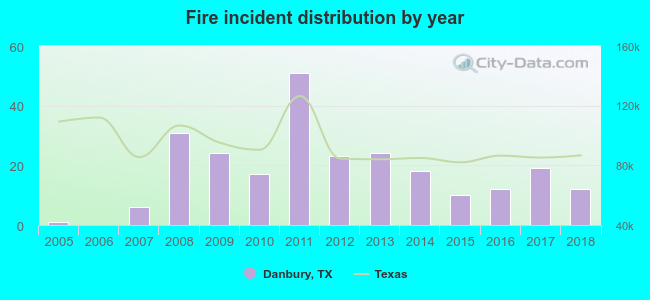 According to the data from the years 2005 - 2018 the average number of fire incidents per year is 18. The highest number of reported fires - 51 took place in 2011, and the least - 0 in 2006. The data has an increasing trend.
 20.2% incidents where reported in the morning and 79.8% in the evening. The most fires (16.9%) took place on Monday, and the least (12.1%) on Thursday.
 According to the 248 fire incidents from years 2005 - 2018 most fires (10.5%) took place during July, and the least (6.0%) in May.
 Out of all 492 cases reported during the years 2005 - 2018, the most belonged to the categories: Fire (50.4%), Rescue & EMS (22.8%), and Hazardous Condition (12.0%).
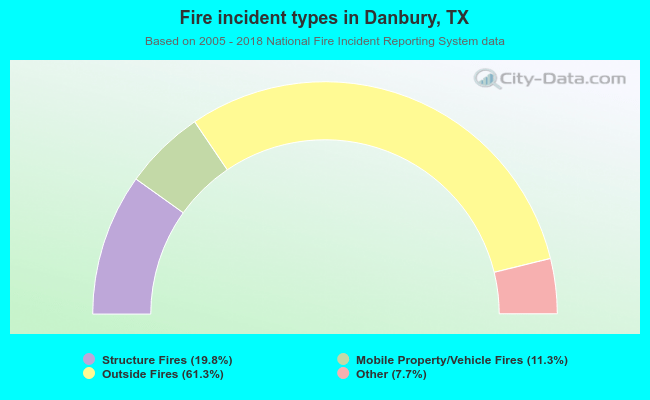 When looking into fire subcategories, the most incidents belonged to: Outside Fires (61.3%), and Structure Fires (19.8%).