| Fire incidents reported |
|---|
| Sreet name | Count |
|---|
| 590 NORTH MAIN STREET | 8 | | NORTH MAIN ST. | 6 | | 123 STAPLES RD | 4 | | 3034 TINMOUTH RD | 4 | | 363 BAKER BROOK RD. | 4 | | 533 STAPLES RD RD | 4 | | 790 GREEN HILL RD | 4 | | BROMLEY RD | 4 | | CASCADE ROAD | 4 | | DANBYPAWLET RD | 4 | | N MAIN ST | 4 | | OLD OTIS RD | 4 | | RT 7 | 4 | | 100 MOUNTAIN VIEW TRAIL | 2 | | 1000 OLD OTIS RD | 2 | | 101 MONTAIN VEIW TRAIL | 2 | | 1031 KELLER ROAD | 2 | | 1034 STAPLES RD | 2 | | 104 DANBY MT. RD | 2 | | 105 NORTH MAIN ST | 2 | | 1052 DANBY HILL RD | 2 | | 108 EDMUNDS RD | 2 | | 11 FISK RD. | 2 | | 118 TINMOUTH RD | 2 | | 1182 SOUTH END RD | 2 |
| | | Fire incidents reported |
|---|
| Sreet name | Count |
|---|
| 120 BAKER BROOK ROAD | 2 | | 133 QUARRY RD | 2 | | 1411 DANBY PAWLET RD | 2 | | 1411 PAWLET RD. | 2 | | 153 TINMOUTH RD | 2 | | 160 EAST POND RD. | 2 | | 164 DAISY HILL RD | 2 | | 164 DAISY HILL ROAD | 2 | | 1672 SCOTTSVILLE RD | 2 | | 1865 LILLY HILL RD | 2 | | 1865 LILY HILL | 2 | | 1865 LILY HILL RD | 2 | | 1949 TINMOUTH RD. | 2 | | 251 BROOK RD | 2 | | 256 CASCADE RD | 2 | | 262 WHITE BIRCH LANE LN | 2 | | 266 CASCADE RD | 2 | | 27 OLD MAPLE LN | 2 | | 27 OLD MAPLE RD | 2 | | 286 SOUTH ST. | 2 | | 2871 OLD OTIS RD | 2 | | 2902 DANBYPAWLET RD | 2 | | 2989 DANBY PAWLET RD | 2 | | 2989 DANBYPAWLET RD | 2 | | 3013 DANBY PAWLET RD | 2 |
|
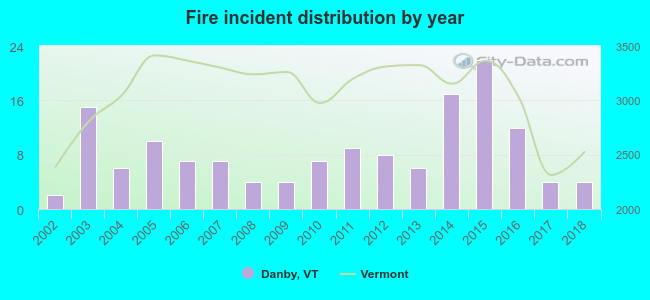 According to the data from the years 2002 - 2018 the average number of fire incidents per year is 8. The highest number of fire incidents - 22 took place in 2015, and the least - 2 in 2002. The data has a growing trend.
 22.9% incidents where reported in the morning and 77.1% in the evening. The most fires (18.1%) took place on Sunday, and the least (10.4%) on Tuesday.
 According to the 144 fire incidents from years 2002 - 2018 most fires (16.7%) took place during February, and the least (4.2%) in July.
 Out of all 370 cases reported during the years 2002 - 2018, the most belonged to the categories: Fire (38.9%), Rescue & EMS (27.6%), and Hazardous Condition (17.3%).
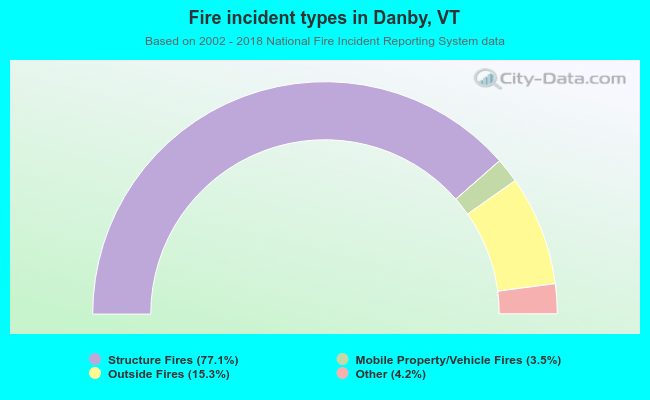 When looking into fire subcategories, the most reports belonged to: Structure Fires (77.1%), and Outside Fires (15.3%).