| Fire incidents reported |
|---|
| Sreet name | Count |
|---|
| WEST FORK RD | 14 | | OLD DARBY RD | 12 | | HWY 93 HWY | 10 | | WATER ST | 10 | | 93 HWY | 8 | | HWY 93 | 8 | | COOPER LOOP | 6 | | GORUS LOOP | 6 | | MAIN ST | 6 | | RYE CREEK RD | 6 | | THORNING LOOP | 6 | | TIN CUP FIRE | 6 | | US HWY 93 HWY | 6 | | CAMP 4 RD | 4 | | CONNER CUTOFF RD | 4 | | MILES ST | 4 | | 103 WATER ST | 2 | | 105 S HILL ST | 2 | | 108 LOST HORSE HILL | 2 | | 115 N MARSHALL RD | 2 | | 120 LITTLE JO ABBY LN | 2 | | 121 CONNER CUT OFF E BRIDGE | 2 | | 151 BUNK HOUSE | 2 | | 151 BUNKHOUSE RD | 2 | | 163 FOREST HILLS RD | 2 |
| | | Fire incidents reported |
|---|
| Sreet name | Count |
|---|
| 179 PAINT HORSE TRAIL | 2 | | 189 BASE CAMP RD | 2 | | 2022 OLD DARBY RD | 2 | | 208 SCHOOL DR DR | 2 | | 248 GROUSE BUTTE LN LN | 2 | | 248 GROUSE BUTTE RD | 2 | | 259 COAL MINE RD RD | 2 | | 2665 HWY 93 SAND COMO RD | 2 | | 2665 HWY 93 N | 2 | | 297 COOPER LOOP | 2 | | 301 S. MARSHALL | 2 | | 302 E TANNER | 2 | | 306 WATER ST | 2 | | 3113 OLD DARBY RD N OF TOWN | 2 | | 3326 HWY 93 | 2 | | 344 CHIEF JOSEPH TRAILS | 2 | | 346 CHAFIN CRK RD RD | 2 | | 370S. MAIN ST | 2 | | 412 CHAFFIN CRK RD | 2 | | 424 FOREST HILLS RD | 2 | | 450 S MAIN ST | 2 | | 4543 HWY 93 S CATTAIL LN | 2 | | 465 HARLON CR RD RD | 2 | | 502 N MAIN | 2 | | |
|
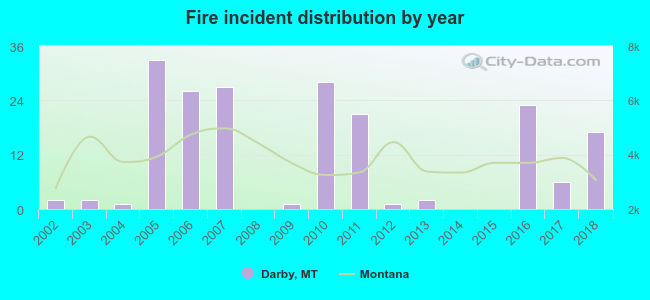 Based on the data from the years 2002 - 2018 the average number of fire incidents per year is 11. The highest number of reported fires - 33 took place in 2005, and the least - 0 in 2008. The data has an increasing trend.
 24.7% incidents where reported in the morning and 75.3% in the evening. The most fires (18.9%) took place on Wednesday, and the least (9.5%) on Tuesday.
 Based on the 190 reports from years 2002 - 2018 most fires (20.5%) took place during August, and the least (1.1%) in November.
 Out of all 352 cases reported during the years 2002 - 2018, the most belonged to the categories: Fire (54.0%), Rescue & EMS (16.8%), and Good Intent Call (12.2%).
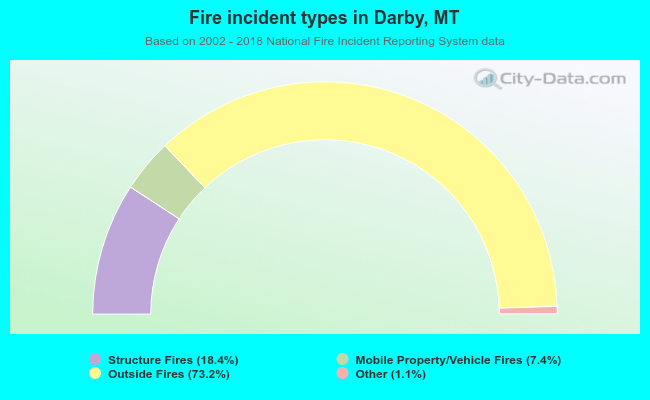 When looking into fire subcategories, the most reports belonged to: Outside Fires (73.2%), and Structure Fires (18.4%).