Darien: Fire Incidents, Wisconsin (WI)
Where are fire incidents reported in Darien, WI
Something went wrong! Please refresh the page.
|
| |||||||||||||||||||||||||||||||||||||||||||||||||||||||||||||||||||||||||||||||||||||||||||||||||||||||||||||
2002 - 2018 National Fire Incident Reporting System (NFIRS) incidents
- Incident types reported to NFIRS in Darien, WI
- 53954.7%Rescue & EMS
- 20020.3%Fire
- 919.2%Good Intent Call
- 686.9%False Alarm
- 656.6%Hazardous Condition
- 151.5%Service Call
- 40.4%Special Incident
- 30.3%Severe Weather
- Fire incident types reported to NFIRS in Darien, WI
- 10954.5%Structure Fires
- 4924.5%Outside Fires
- 2713.5%Mobile Property/Vehicle Fires
- 157.5%Other
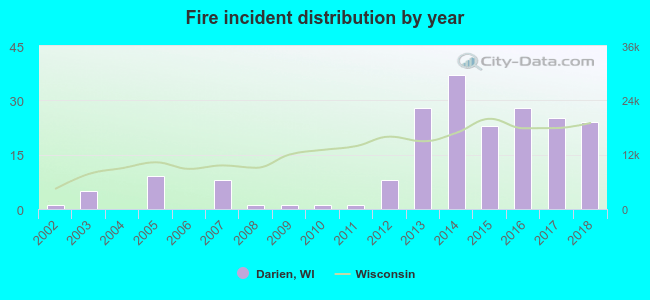 Based on the data from the years 2002 - 2018 the average number of fire incidents per year is 12. The highest number of fire incidents - 37 took place in 2014, and the least - 0 in 2004. The data has a growing trend.
 50.0% incidents where reported in the morning and 50.0% in the evening. The most fires (17.5%) took place on Thursday, and the least (8.5%) on Sunday.
 According to the 200 incident reports from years 2002 - 2018 most fires (12.0%) took place during April, and the least (4.0%) in October.
 Out of all 985 cases reported during the years 2002 - 2018, the most belonged to the categories: Overpressure Rupture (54.7%), Fire (20.3%), and Service Call (9.2%).
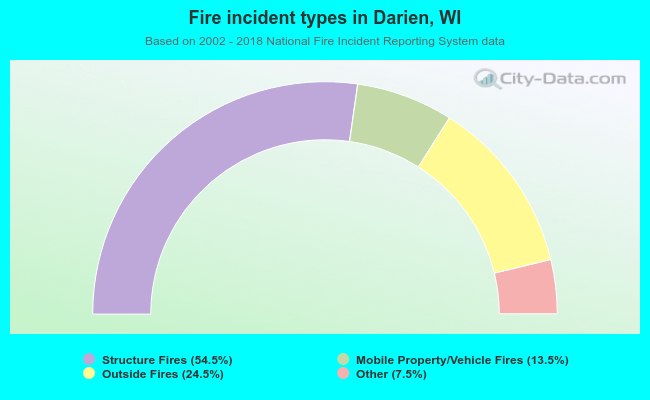 When looking into fire subcategories, the most incidents belonged to: Structure Fires (54.5%), and Outside Fires (24.5%).