Delafield: Fire Incidents, Wisconsin (WI)
Where are fire incidents reported in Delafield, WI
Something went wrong! Please refresh the page.
|
| |||||||||||||||||||||||||||||||||||||||||||||||||||||||||||||||||||||||||||||||||||||||||||||||||||||||||||||
2003 - 2018 National Fire Incident Reporting System (NFIRS) incidents
- Incident types reported to NFIRS in Delafield, WI
- 2,24960.3%Rescue & EMS
- 44211.9%Fire
- 3419.1%Hazardous Condition
- 2807.5%Good Intent Call
- 2647.1%False Alarm
- 1213.2%Service Call
- 170.5%Severe Weather
- 110.3%Overpressure Rupture
- 40.1%Special Incident
- Fire incident types reported to NFIRS in Delafield, WI
- 24154.5%Structure Fires
- 12829.0%Outside Fires
- 6414.5%Mobile Property/Vehicle Fires
- 92.0%Other
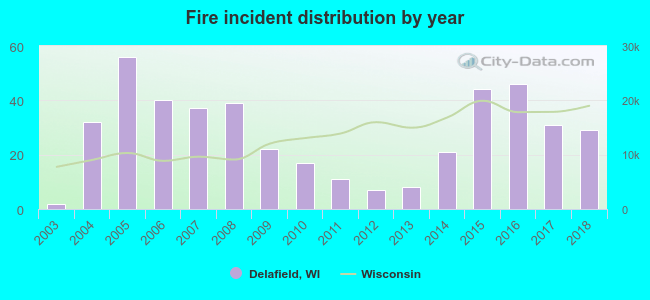 Based on the data from the years 2003 - 2018 the average number of fires per year is 28. The highest number of fires - 56 took place in 2005, and the least - 2 in 2003. The data has a growing trend.
The average number of yearly fire incidents per 10k residents in Delafield, WI compared to nearest cities:
(Note: Based on data for the last 3 years, including only cities with population 5,000 and above)
| Delafield: | 49.3 |
| Hartland: | 55.8 |
| Oconomowoc: | 68.8 |
| Genesee: | 1.8 |
| Pewaukee: | 40.9 |
| Waukesha: | 23.6 |
| Lisbon: | 3.0 |
| Sussex: | 23.0 |
| Richfield: | 20.9 |

 29.4% incidents where reported in the morning and 70.6% in the evening. The most fires (18.3%) took place on Monday, and the least (10.4%) on Thursday.
 Based on the 442 incident reports from years 2003 - 2018 most fires (16.1%) took place during April, and the least (6.1%) in October.
 Out of all 3,729 cases reported during the years 2003 - 2018, the most belonged to the categories: Rescue & EMS (60.3%), Fire (11.9%), and Hazardous Condition (9.1%).
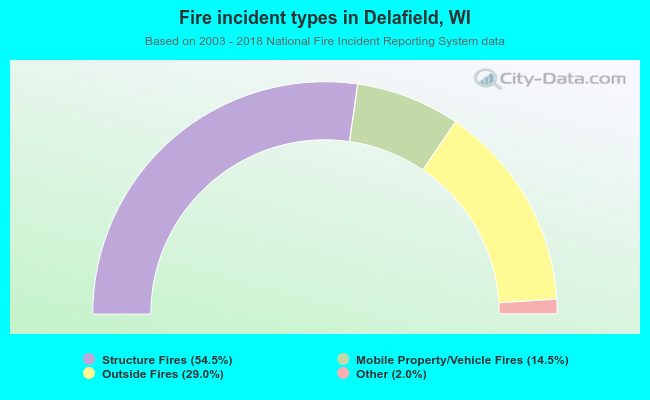 When looking into fire subcategories, the most incidents belonged to: Structure Fires (54.5%), and Outside Fires (29.0%).