Delaware: Fire Incidents, Ohio (OH)
Where are fire incidents reported in Delaware, OH
Something went wrong! Please refresh the page.
| Fire incidents reported | |
|---|---|
| Sreet name | Count |
| SANDUSKY ST | 336 |
| WILLIAM ST | 198 |
| COLUMBUS PIKE | 174 |
| CENTRAL AVE | 162 |
| LIBERTY RD | 128 |
| LIBERTY ST | 124 |
| WINTER ST | 124 |
| SR 37 | 116 |
| US 23 | 108 |
| CHELSEA ST | 96 |
| PITTSBURGH DR | 94 |
| WASHINGTON ST | 94 |
| US 42 | 82 |
| SUNBURY RD | 80 |
| LONDON RD | 74 |
| FRANKLIN ST | 72 |
| MUIRWOOD VILLAGE DR | 64 |
| WILLIAMS DR | 60 |
| CURTIS ST | 58 |
| DUBLIN RD | 54 |
| TROY RD | 54 |
| HENRY ST | 48 |
| PENNSYLVANIA AVE | 48 |
| RIVERSIDE DR | 48 |
| CURVE RD | 46 |
| LAKE ST | 46 |
| UNION ST | 46 |
| BERLIN STATION RD | 44 |
| BUNTY STATION RD | 44 |
| PARK AVE | 44 |
| Other | 1,103 |
2002 - 2018 National Fire Incident Reporting System (NFIRS) incidents
- Incident types reported to NFIRS in Delaware, OH
- 18,19155.5%Rescue & EMS
- 3,86911.8%Fire
- 3,62011.0%Hazardous Condition
- 3,0619.3%False Alarm
- 1,9726.0%Service Call
- 1,9185.8%Good Intent Call
- 690.2%Special Incident
- 600.2%Overpressure Rupture
- 420.1%Severe Weather
- Fire incident types reported to NFIRS in Delaware, OH
- 2,40862.2%Structure Fires
- 92023.8%Outside Fires
- 52313.5%Mobile Property/Vehicle Fires
- 180.5%Other
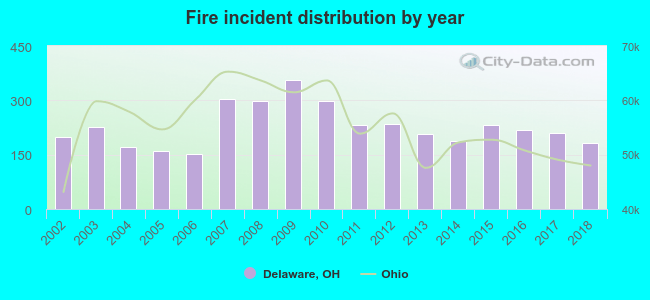 According to the data from the years 2002 - 2018 the average number of fire incidents per year is 228. The highest number of fire incidents - 357 took place in 2009, and the least - 151 in 2006. The data has a decreasing trend.
The average number of yearly fire incidents per 10k residents in Delaware, OH compared to nearest cities:
(Note: Based on data for the last 3 years, including only cities with population 5,000 and above)
| Delaware: | 54.3 |
| Powell: | 33.0 |
| Dublin: | 22.9 |
| Westerville: | 14.8 |
| Worthington: | 24.6 |
| Marysville: | 39.6 |
| Hilliard: | 26.7 |
| Upper Arlington: | 17.7 |
| Marion: | 69.5 |
 The median response time based on all reported fire incidents is 7 minutes. This is similar to the state median value.
The median response time in Delaware, OH compared to nearest cities:
(Note: Based on data for all years, including only cities with at least 500 fire incidents)
| Delaware: | 7 minutes |
| Powell: | 6 minutes |
| Ashley: | 9 minutes |
| Galena: | 7 minutes |
| Sunbury: | 9 minutes |
| Dublin: | 5 minutes |
| Westerville: | 6 minutes |
| Worthington: | 4 minutes |
| Richwood: | 9 minutes |
 According to the data from the years 2002 - 2018 the average number of fire-related yearly deaths is 0. The highest number of deaths - 3 took place in 2010, and the lowest - 0 in 2002. The data has a constant trend.
The average number of fatalities per 1,000 fires is 1. This indicator was the highest - 10 in 2010, and the lowest 0 in 2002. The trend for deaths per 1,000 fire incidents is constant. Compared to the Ohio value the number of deaths per 1,000 fires is lower.
According to the data from the years 2002 - 2018 the average number of fire-related yearly deaths is 0. The highest number of deaths - 3 took place in 2010, and the lowest - 0 in 2002. The data has a constant trend.
The average number of fatalities per 1,000 fires is 1. This indicator was the highest - 10 in 2010, and the lowest 0 in 2002. The trend for deaths per 1,000 fire incidents is constant. Compared to the Ohio value the number of deaths per 1,000 fires is lower.
 Based on the reports from the years 2002 - 2018 the average number of fire-related yearly casualties is 4. The highest number of casualties - 9 took place in 2018, and the lowest - 1 in 2003. The data has a growing trend.
The average number of injuries per 1,000 fire incidents is 17. This indicator was the highest - 49 in 2018, and the lowest 3 in 2007. The trend for injuries per 1,000 incidents is growing. Compared to the state value the number of injuries per 1,000 fires is similar.
Based on the reports from the years 2002 - 2018 the average number of fire-related yearly casualties is 4. The highest number of casualties - 9 took place in 2018, and the lowest - 1 in 2003. The data has a growing trend.
The average number of injuries per 1,000 fire incidents is 17. This indicator was the highest - 49 in 2018, and the lowest 3 in 2007. The trend for injuries per 1,000 incidents is growing. Compared to the state value the number of injuries per 1,000 fires is similar.Casualties per 1,000 incidents in Delaware, OH compared to nearest cities:
(Note: Based on data for all years, including only cities with at least 500 fire incidents)
| Delaware: | 16.5 |
| Powell: | 11.1 |
| Ashley: | 5.7 |
| Galena: | 5.2 |
| Sunbury: | 4.1 |
| Dublin: | 2.4 |
| Westerville: | 15.6 |
| Worthington: | 10.2 |
| Richwood: | 18.7 |
 31.7% incidents where reported in the morning and 68.3% in the evening. The most fires (15.1%) took place on Saturday, and the least (13.2%) on Sunday.
 According to the 3,869 reports from years 2002 - 2018 most fires (10.0%) took place during November, and the least (7.1%) in February.
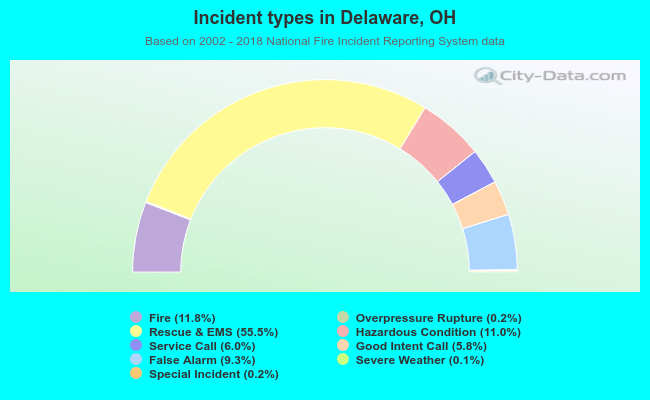 Out of all 32,802 cases reported during the years 2002 - 2018, the most belonged to the categories: Rescue & EMS (55.5%), Fire (11.8%), and Hazardous Condition (11.0%).
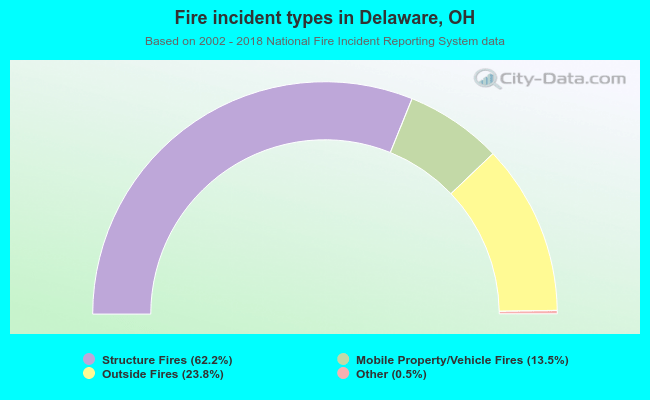 When looking into fire subcategories, the most incidents belonged to: Structure Fires (62.2%), and Outside Fires (23.8%).