Demarest: Fire Incidents, New Jersey (NJ)
Where are fire incidents reported in Demarest, NJ
Something went wrong! Please refresh the page.
|
| |||||||||||||||||||||||||||||||||||||||||||||||||||||||||||||||||||||||||||||||||||||||||||||||||||||||||||||
2002 - 2018 National Fire Incident Reporting System (NFIRS) incidents
- Incident types reported to NFIRS in Demarest, NJ
- 63638.7%False Alarm
- 62938.2%Hazardous Condition
- 20812.6%Fire
- 734.4%Good Intent Call
- 573.5%Service Call
- 161.0%Special Incident
- 130.8%Rescue & EMS
- 80.5%Overpressure Rupture
- 50.3%Severe Weather
- Fire incident types reported to NFIRS in Demarest, NJ
- 14368.8%Structure Fires
- 3818.3%Outside Fires
- 157.2%Other
- 125.8%Mobile Property/Vehicle Fires
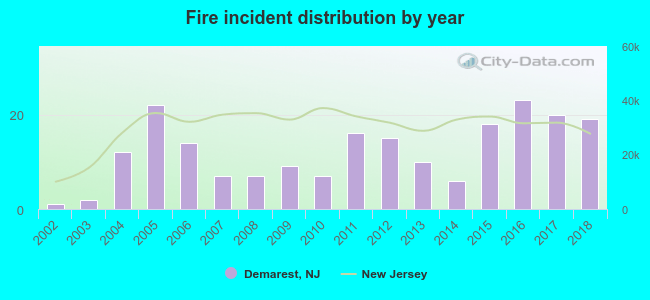 Based on the data from the years 2002 - 2018 the average number of fire incidents per year is 12. The highest number of fire incidents - 23 took place in 2016, and the least - 1 in 2002. The data has a rising trend.
 Based on the data from the years 2002 - 2018 the average number of fire-related yearly casualties is 0. The highest number of reported injuries - 3 took place in 2017, and the lowest - 0 in 2002. The data has a constant trend.
 33.2% incidents where reported in the morning and 66.8% in the evening. The most fires (17.8%) took place on Tuesday, and the least (7.2%) on Thursday.
 According to the 208 fire incidents from years 2002 - 2018 most fires (14.4%) took place during January, and the least (4.3%) in October.
 Out of all 1,645 cases reported during the years 2002 - 2018, the most belonged to the categories: False Alarm (38.7%), Hazardous Condition (38.2%), and Fire (12.6%).
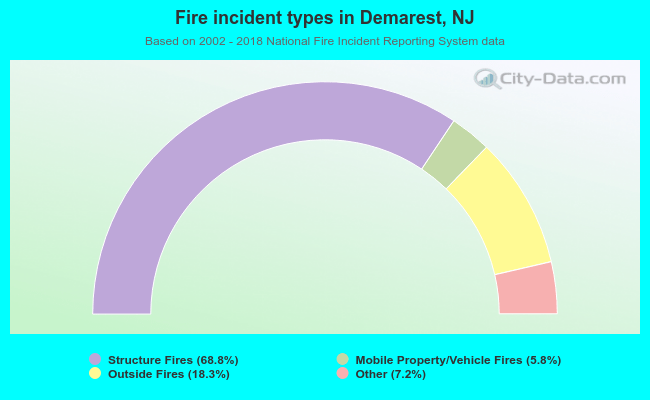 When looking into fire subcategories, the most reports belonged to: Structure Fires (68.8%), and Outside Fires (18.3%).