Dennison: Fire Incidents, Ohio (OH)
Where are fire incidents reported in Dennison, OH
Something went wrong! Please refresh the page.
|
| |||||||||||||||||||||||||||||||||||||||||||||||||||||||||||||||||||||||||||||||||||||||||||||||||||||||||||||
2002 - 2018 National Fire Incident Reporting System (NFIRS) incidents
- Incident types reported to NFIRS in Dennison, OH
- 1,09229.3%Hazardous Condition
- 85923.0%Good Intent Call
- 66317.8%Rescue & EMS
- 48613.0%Fire
- 3028.1%Service Call
- 2947.9%False Alarm
- 150.4%Severe Weather
- 150.4%Special Incident
- Fire incident types reported to NFIRS in Dennison, OH
- 28258.0%Structure Fires
- 15231.3%Outside Fires
- 479.7%Mobile Property/Vehicle Fires
- 51.0%Other
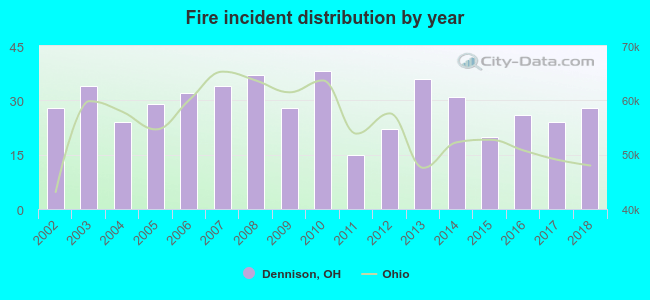 According to the data from the years 2002 - 2018 the average number of fire incidents per year is 29. The highest number of reported fires - 38 took place in 2010, and the least - 15 in 2011. The data has a constant trend.
 According to the data from the years 2002 - 2018 the average number of fire-related yearly casualties is 0. The highest number of reported casualties - 2 took place in 2017, and the lowest - 0 in 2002. The data has a constant trend.
 24.7% incidents where reported in the morning and 75.3% in the evening. The most fires (17.3%) took place on Saturday, and the least (11.7%) on Friday.
 According to the 486 fire incident reports from years 2002 - 2018 most fires (10.7%) took place during March, and the least (6.6%) in June.
 Out of all 3,729 cases reported during the years 2002 - 2018, the most belonged to the categories: Hazardous Condition (29.3%), Good Intent Call (23.0%), and Rescue & EMS (17.8%).
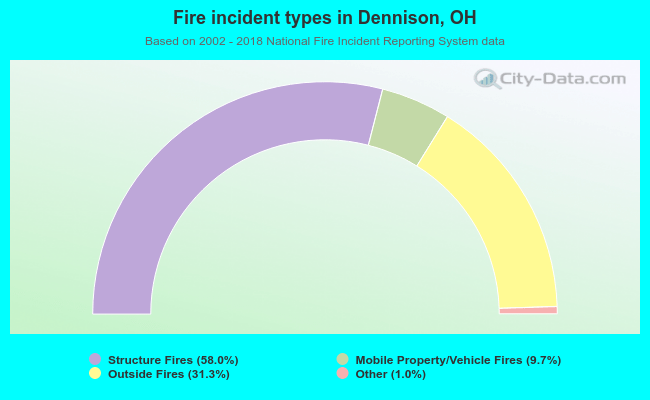 When looking into fire subcategories, the most reports belonged to: Structure Fires (58.0%), and Outside Fires (31.3%).