Destrehan: Fire Incidents, Louisiana (LA)
Where are fire incidents reported in Destrehan, LA
Something went wrong! Please refresh the page.
|
| |||||||||||||||||||||||||||||||||||||||||||||||||||||||||||||||||||||||||||||||||||||||||||||||||||||||||||||
2002 - 2018 National Fire Incident Reporting System (NFIRS) incidents
- Incident types reported to NFIRS in Destrehan, LA
- 62827.8%Good Intent Call
- 50722.4%Hazardous Condition
- 45320.1%Fire
- 33514.8%Rescue & EMS
- 27712.3%False Alarm
- 351.5%Service Call
- 200.9%Special Incident
- 30.1%Overpressure Rupture
- Fire incident types reported to NFIRS in Destrehan, LA
- 18741.3%Outside Fires
- 17137.7%Structure Fires
- 6815.0%Mobile Property/Vehicle Fires
- 276.0%Other
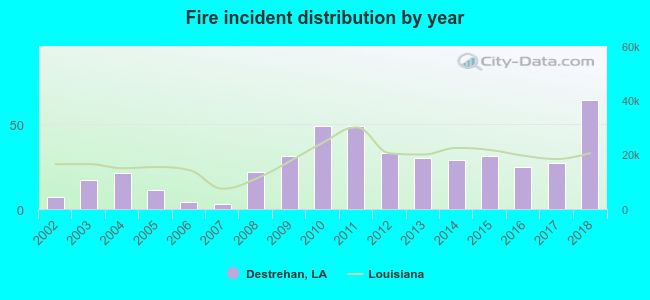 According to the data from the years 2002 - 2018 the average number of fires per year is 27. The highest number of reported fire incidents - 64 took place in 2018, and the least - 3 in 2007. The data has an increasing trend.
The average number of yearly fire incidents per 10k residents in Destrehan, LA compared to nearest cities:
(Note: Based on data for the last 3 years, including only cities with population 5,000 and above)
| Destrehan: | 33.5 |
| Luling: | 26.4 |
| Kenner: | 25.8 |
| Waggaman: | 26.3 |
| River Ridge: | 15.3 |
| Harahan: | 3.9 |
| Laplace: | 38.1 |
| Metairie: | 15.6 |
| Bridge City: | 23.4 |
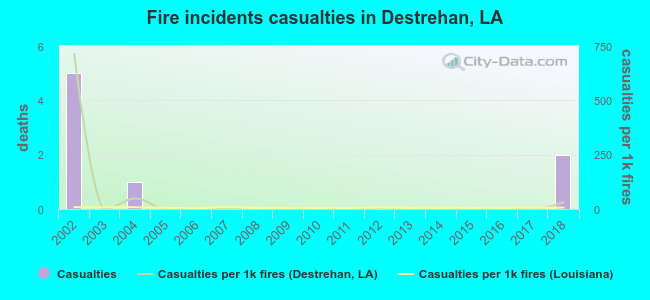 Based on the reports from the years 2002 - 2018 the average number of fire-related yearly casualties is 0. The highest number of injuries - 5 took place in 2002, and the lowest - 0 in 2003. The data has a declining trend.
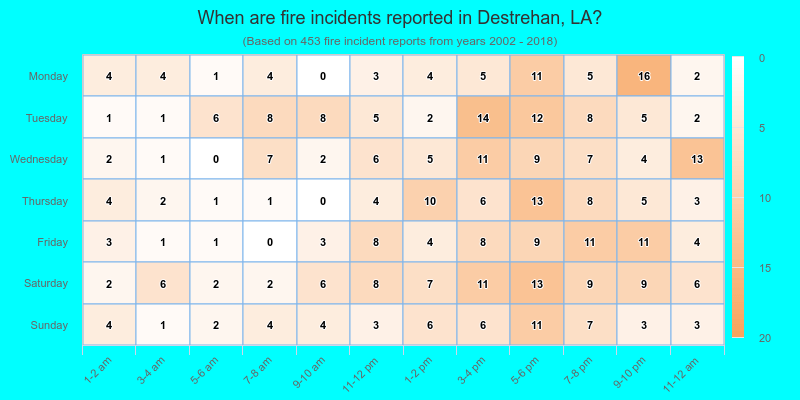
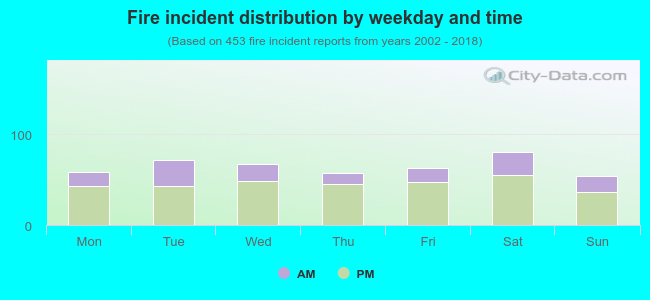 29.8% incidents where reported in the morning and 70.2% in the evening. The most fires (17.9%) took place on Saturday, and the least (11.9%) on Sunday.
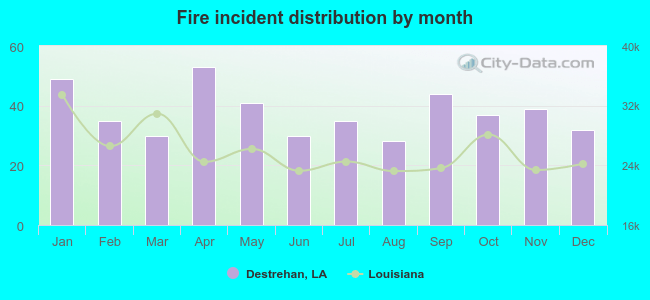 Based on the 453 fire incident reports from years 2002 - 2018 most fires (11.7%) took place during April, and the least (6.2%) in August.
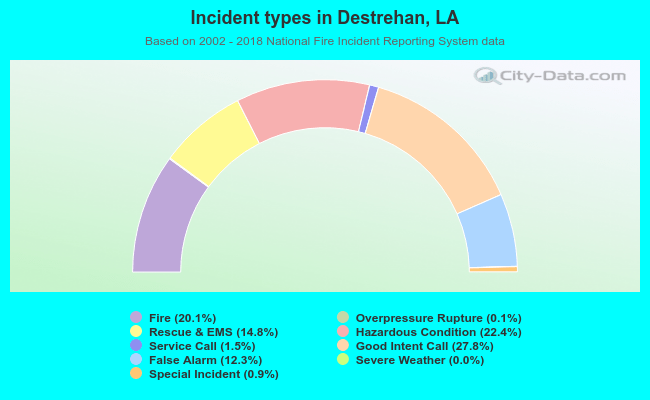 Out of all 2,259 cases reported during the years 2002 - 2018, the most belonged to the categories: Good Intent Call (27.8%), Hazardous Condition (22.4%), and Fire (20.1%).
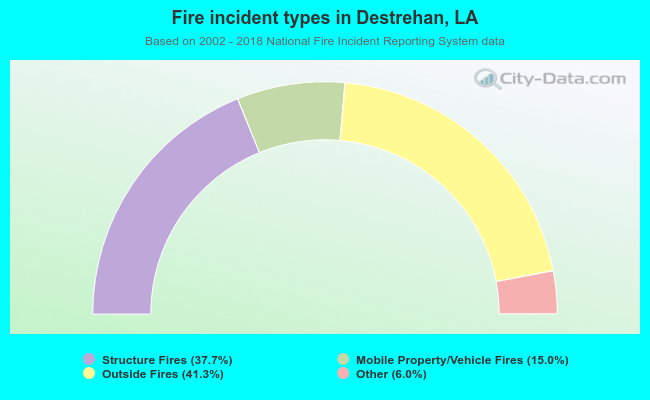 When looking into fire subcategories, the most incidents belonged to: Outside Fires (41.3%), and Structure Fires (37.7%).