Dexter: Fire Incidents, Kansas (KS)
Where are fire incidents reported in Dexter, KS
Something went wrong! Please refresh the page.
|
| |||||||||||||||||||||||||||||||||||||||||||||||||||||||||||||||||||||||||||||||||||||||||||||||||||||||||||||
| Other | 44 | |||||||||||||||||||||||||||||||||||||||||||||||||||||||||||||||||||||||||||||||||||||||||||||||||||||||||||||
2003 - 2018 National Fire Incident Reporting System (NFIRS) incidents
- Incident types reported to NFIRS in Dexter, KS
- 19659.6%Fire
- 7623.1%Rescue & EMS
- 3510.6%Good Intent Call
- 144.3%Service Call
- 41.2%Hazardous Condition
- 41.2%False Alarm
- Fire incident types reported to NFIRS in Dexter, KS
- 14574.0%Outside Fires
- 3919.9%Structure Fires
- 115.6%Mobile Property/Vehicle Fires
- 10.5%Other
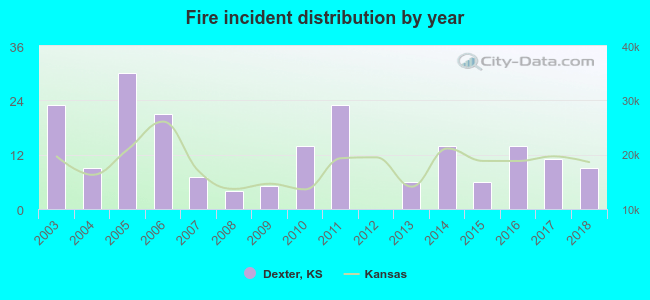 Based on the data from the years 2003 - 2018 the average number of fires per year is 12. The highest number of fire incidents - 30 took place in 2005, and the least - 0 in 2012. The data has a decreasing trend.
 25.0% incidents where reported in the morning and 75.0% in the evening. The most fires (19.4%) took place on Saturday, and the least (9.7%) on Thursday.
 According to the 196 reports from years 2003 - 2018 most fires (28.6%) took place during April, and the least (0.5%) in October.
 Out of all 329 cases reported during the years 2003 - 2018, the most belonged to the categories: Fire (59.6%), Overpressure Rupture (23.1%), and Service Call (10.6%).
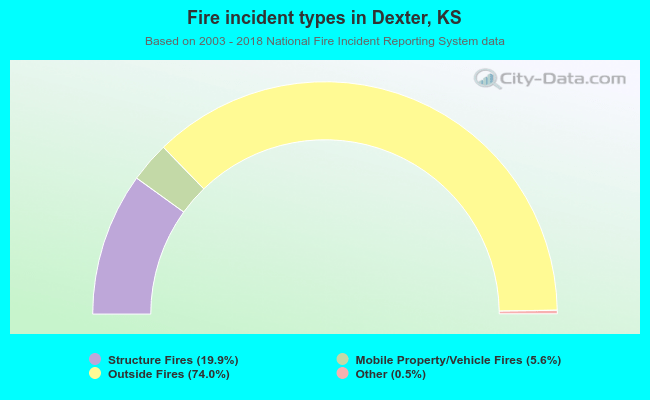 When looking into fire subcategories, the most incidents belonged to: Outside Fires (74.0%), and Structure Fires (19.9%).