| Fire incidents reported |
|---|
| Sreet name | Count |
|---|
| HIGHWAY 18 EAST | 18 | | HURLEY RD | 12 | | CINDY LANE | 10 | | HURLEY RD | 10 | | VAN DYKE RD | 10 | | 1605 TUCKER RD | 8 | | 2900 MARION DRIVE | 8 | | HIGHWAY 367 NORTH | 8 | | HOOPER ST | 8 | | HWY 18 EAST | 8 | | JACKSON 274 HIGHWAY 17 NORTH | 8 | | MAIN ST | 8 | | VAN DYKE RD | 8 | | WEST MAIN | 8 | | CARR CIRCLE | 6 | | CINDY LN | 6 | | JACKSON 273 | 6 | | SARAH DR | 6 | | THAXTON ST | 6 | | US 67 MM 87 | 6 | | 2737 CARR CIRCLE | 4 | | 2900 MARION DR | 4 | | 3201 AIRBASE RD | 4 | | 3308 WILLIAMS | 4 | | 5501 WEST MAIN | 4 |
| | | Fire incidents reported |
|---|
| Sreet name | Count |
|---|
| FAIRGROUNDS ROAD RD | 4 | | HIGHWAY 167 | 4 | | HWY 367 N | 4 | | JACKSON 247 RD | 4 | | MARION DR | 4 | | MICKEY CIR | 4 | | S. MAIN ST | 4 | | SAN MATEO PARK | 4 | | SEXTON ST | 4 | | SOUTH MAIN | 4 | | US 67 MM 89 | 4 | | #4 JW DRIVE | 2 | | 1315 CINDY LN | 2 | | 1321 CINDY LANE | 2 | | 1335 CINDY LN | 2 | | 14 LAKEVIEW | 2 | | 1401 HEATHER LANE ST | 2 | | 1500 PARKVIEW RD | 2 | | 1501 HEATHER LANE | 2 | | 16 LAKEVIEW | 2 | | 16 LAKEVIEW RD | 2 | | 1601HEATHER LANE | 2 | | 1604 HURLEY RD | 2 | | 1604 OAK ST | 2 | | 1608 OAK DR | 2 |
|
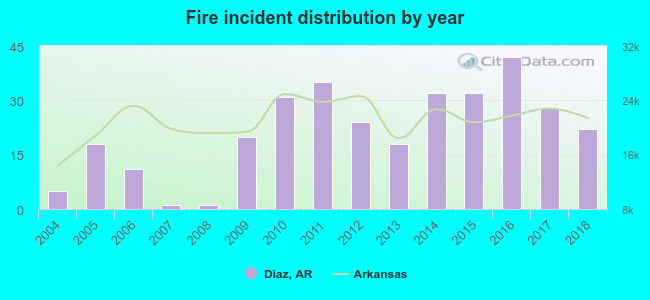 According to the data from the years 2004 - 2018 the average number of fires per year is 21. The highest number of fire incidents - 42 took place in 2016, and the least - 1 in 2007. The data has a rising trend.
 20.9% incidents where reported in the morning and 79.1% in the evening. The most fires (18.1%) took place on Monday, and the least (11.5%) on Wednesday.
 According to the 321 incident reports from years 2004 - 2018 most fires (14.6%) took place during February, and the least (5.3%) in April.
 Out of all 376 cases reported during the years 2004 - 2018, the most belonged to the categories: Fire (85.4%), False Alarm (3.5%), and Good Intent Call (3.2%).
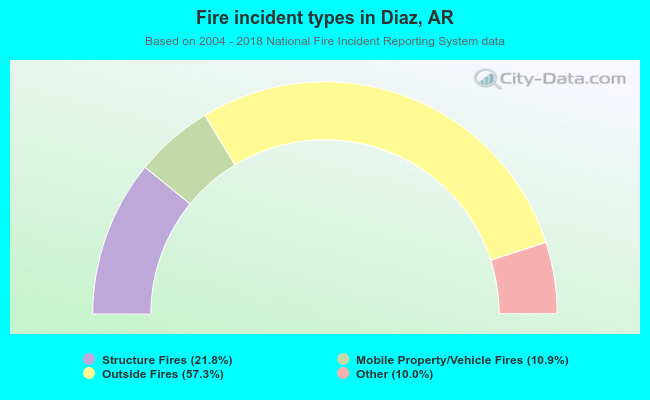 When looking into fire subcategories, the most incidents belonged to: Outside Fires (57.3%), and Structure Fires (21.8%).