Dillingham: Fire Incidents, Alaska (AK)
Where are fire incidents reported in Dillingham, AK
Something went wrong! Please refresh the page.
|
| |||||||||||||||||||||||||||||||||||||||||||||||||||||||||||||||||||||||||||||||||||||||||||||||||||||||||||||
2002 - 2018 National Fire Incident Reporting System (NFIRS) incidents
- Incident types reported to NFIRS in Dillingham, AK
- 20678.6%Fire
- 228.4%Good Intent Call
- 145.3%False Alarm
- 103.8%Hazardous Condition
- 51.9%Rescue & EMS
- 41.5%Service Call
- 10.4%Special Incident
- Fire incident types reported to NFIRS in Dillingham, AK
- 12661.2%Structure Fires
- 4119.9%Outside Fires
- 3215.5%Mobile Property/Vehicle Fires
- 73.4%Other
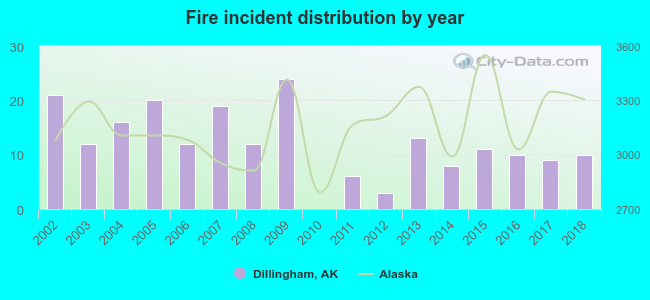 According to the data from the years 2002 - 2018 the average number of fires per year is 12. The highest number of reported fires - 24 took place in 2009, and the least - 0 in 2010. The data has a declining trend.
 Based on the data from the years 2002 - 2018 the average number of fire-related fatalities per year is 0. The highest number of deaths - 1 took place in 2005, and the lowest - 0 in 2002. The data has a constant trend.
 Based on the reports from the years 2002 - 2018 the average number of fire-related casualties per year is 1. The highest number of casualties - 8 took place in 2007, and the lowest - 0 in 2002. The data has a constant trend.
 30.6% incidents where reported in the morning and 69.4% in the evening. The most fires (15.5%) took place on Friday, and the least (11.2%) on Tuesday.
 According to the 206 reports from years 2002 - 2018 most fires (18.9%) took place during May, and the least (3.4%) in September.
 Out of all 262 cases reported during the years 2002 - 2018, the most belonged to the categories: Fire (78.6%), Service Call (8.4%), and Good Intent Call (5.3%).
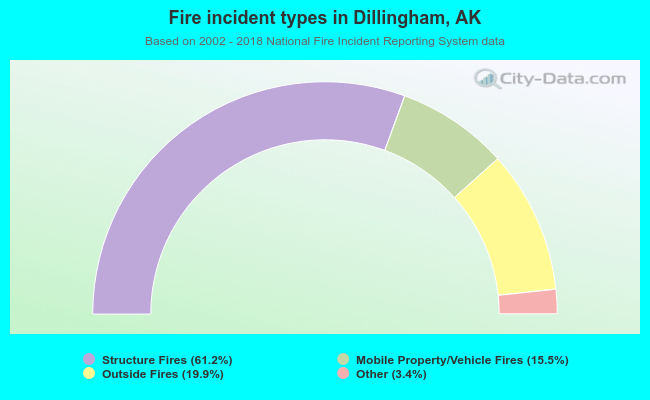 When looking into fire subcategories, the most incidents belonged to: Structure Fires (61.2%), and Outside Fires (19.9%).