Dillsboro: Fire Incidents, Indiana (IN)
Where are fire incidents reported in Dillsboro, IN
Something went wrong! Please refresh the page.
|
| |||||||||||||||||||||||||||||||||||||||||||||||||||||||||||||||||||||||||||||||||||||||||||||||||||||||||||||
2002 - 2017 National Fire Incident Reporting System (NFIRS) incidents
- Incident types reported to NFIRS in Dillsboro, IN
- 23839.4%Fire
- 19932.9%Rescue & EMS
- 579.4%Hazardous Condition
- 447.3%Good Intent Call
- 376.1%Service Call
- 213.5%False Alarm
- 61.0%Severe Weather
- 10.2%Overpressure Rupture
- 10.2%Special Incident
- Fire incident types reported to NFIRS in Dillsboro, IN
- 10745.0%Structure Fires
- 8134.0%Outside Fires
- 3313.9%Mobile Property/Vehicle Fires
- 177.1%Other
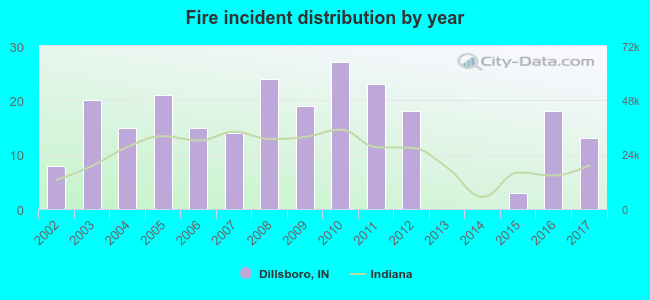 According to the data from the years 2002 - 2017 the average number of fire incidents per year is 15. The highest number of fires - 27 took place in 2010, and the least - 0 in 2013. The data has a growing trend.
 29.8% incidents where reported in the morning and 70.2% in the evening. The most fires (18.1%) took place on Wednesday, and the least (10.9%) on Thursday.
 According to the 238 incident reports from years 2002 - 2017 most fires (15.1%) took place during April, and the least (5.0%) in August.
 Out of all 604 cases reported during the years 2002 - 2017, the most belonged to the categories: Fire (39.4%), Rescue & EMS (32.9%), and Hazardous Condition (9.4%).
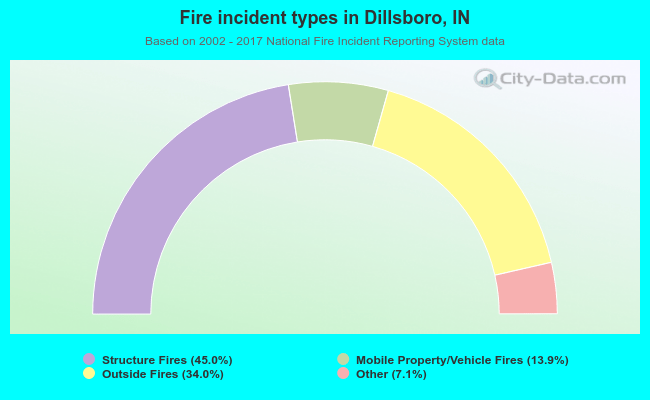 When looking into fire subcategories, the most reports belonged to: Structure Fires (45.0%), and Outside Fires (34.0%).