| Fire incidents reported |
|---|
| Sreet name | Count |
|---|
| ROUTE 30 | 10 | | 1045 KIRBY HOLLOW ROAD | 8 | | 1054 LOWER HOLLOW ROAD | 8 | | 2296 ROUTE 30 | 6 | | 4241 ROUTE 30 | 6 | | BLACK ROCK LANE | 6 | | 104 KIRBY HOLLOW ROAD | 4 | | 1054 LOWER HOLLOW RD | 4 | | 121 NICHOLS HILL ROAD | 4 | | 1776 ROUTE 30 | 4 | | 194 GROUSE LANE | 4 | | 20 NICHOLS HILL ROAD | 4 | | 2296 VT RT 30 | 4 | | 349 DOG PATCH LANE | 4 | | 3518 ROUTE 30 | 4 | | 38 DANBY MOUNTAIN ROAD | 4 | | 452 PAULS WAY | 4 | | 51 PECKMAN LANE | 4 | | 512 PEACE STREET | 4 | | 567 KIRBY HOLLOW RD | 4 | | 602 BLACK ROCK LANE | 4 | | 8 CHURCH ST | 4 | | 8 CHURCH STREET | 4 | | RT 30 | 4 | | 1015 DORSET WEST RD | 2 |
| | | Fire incidents reported |
|---|
| Sreet name | Count |
|---|
| 1015 DORSET WEST RD | 2 | | 102 CHURCH STREET | 2 | | 1024 KIRBY HOLLOW RD | 2 | | 1035 ROUTE 30 | 2 | | 1035 RT 30 | 2 | | 1045 KIRBY HOLLOW | 2 | | 1045 KIRBY HOLLOW RD | 2 | | 105 MEADOW LN | 2 | | 1084 DORSET WEST ROAD | 2 | | 1084 ELLIOT DORSET WEST RD | 2 | | 1127 KIRBY HOLLOW RD | 2 | | 1127 KIRBY HOLLOW RD | 2 | | 1150 NICHOLS HILL ROAD | 2 | | 1150 NICOLAS HILL | 2 | | 1161 ROUTE 30 | 2 | | 1197 DORSET WEST RD | 2 | | 121 LANE RD | 2 | | 121 LANE ROAD | 2 | | 126 FOOTE ROAD | 2 | | 127 BIRCHSTONE LN | 2 | | 1270 DORSET WEST ROAD | 2 | | 1284 DORSET WEST ROAD | 2 | | 1377 | 2 | | 1377 ROUTE 30 | 2 | | |
|
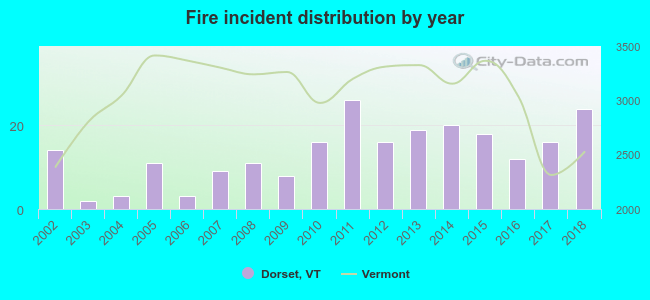 According to the data from the years 2002 - 2018 the average number of fire incidents per year is 13. The highest number of fire incidents - 26 took place in 2011, and the least - 2 in 2003. The data has a growing trend.
 According to the data from the years 2002 - 2018 the average number of fire-related yearly casualties is 0. The highest number of reported casualties - 1 took place in 2004, and the lowest - 0 in 2002. The data has a constant trend.
 27.2% incidents where reported in the morning and 72.8% in the evening. The most fires (17.1%) took place on Monday, and the least (9.6%) on Thursday.
 According to the 228 fire incidents from years 2002 - 2018 most fires (14.0%) took place during May, and the least (3.9%) in August.
 Out of all 950 cases reported during the years 2002 - 2018, the most belonged to the categories: False Alarm (37.6%), Fire (24.0%), and Hazardous Condition (18.0%).
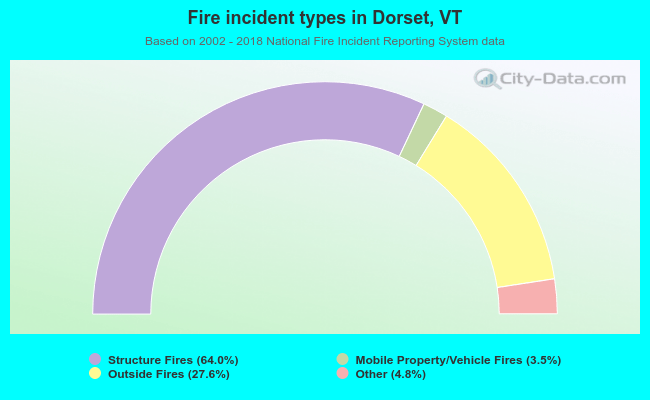 When looking into fire subcategories, the most incidents belonged to: Structure Fires (64.0%), and Outside Fires (27.6%).