Drake: Fire Incidents, North Dakota (ND)
Where are fire incidents reported in Drake, ND
Something went wrong! Please refresh the page.
|
| |||||||||||||||||||||||||||||||||||||||||||||
| Other | 75 | |||||||||||||||||||||||||||||||||||||||||||||
2002 - 2017 National Fire Incident Reporting System (NFIRS) incidents
- Incident types reported to NFIRS in Drake, ND
- 11175.0%Fire
- 1812.2%Rescue & EMS
- 96.1%Hazardous Condition
- 64.1%Good Intent Call
- 21.4%False Alarm
- 10.7%Severe Weather
- 10.7%Special Incident
- Fire incident types reported to NFIRS in Drake, ND
- 7365.8%Outside Fires
- 2522.5%Structure Fires
- 1311.7%Mobile Property/Vehicle Fires
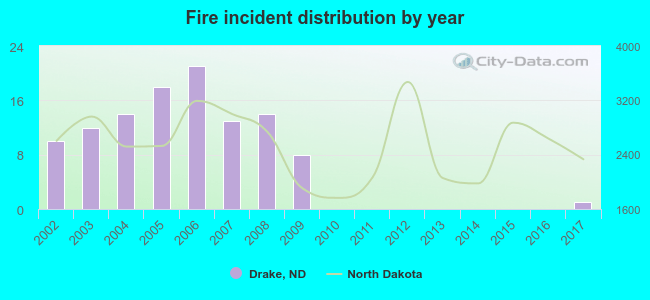 Based on the data from the years 2002 - 2017 the average number of fires per year is 7. The highest number of reported fires - 21 took place in 2006, and the least - 0 in 2010. The data has a declining trend.
 20.7% incidents where reported in the morning and 79.3% in the evening. The most fires (16.2%) took place on Wednesday, and the least (8.1%) on Saturday.
 According to the 111 fire incidents from years 2002 - 2017 most fires (25.2%) took place during April, and the least (0.0%) in February.
 Out of all 148 cases reported during the years 2002 - 2017, the most belonged to the categories: Fire (75.0%), Overpressure Rupture (12.2%), and Rescue & EMS (6.1%).
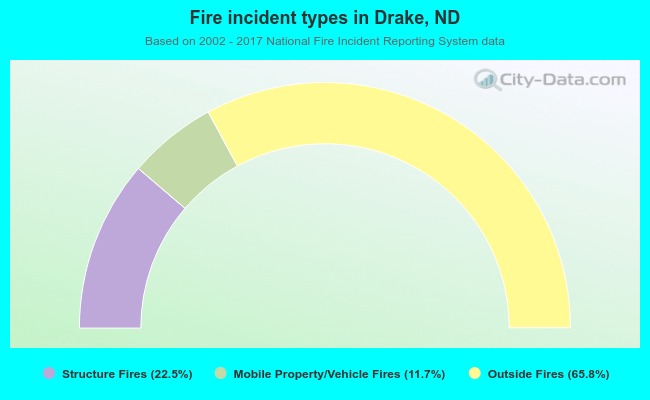 When looking into fire subcategories, the most reports belonged to: Outside Fires (65.8%), and Structure Fires (22.5%).