DuBois: Fire Incidents, Pennsylvania (PA)
Where are fire incidents reported in DuBois, PA
Something went wrong! Please refresh the page.
|
| |||||||||||||||||||||||||||||||||||||||||||||||||||||||||||||||||||||||||||||||||||||||||||||||||||||||||||||
| Other | 125 | |||||||||||||||||||||||||||||||||||||||||||||||||||||||||||||||||||||||||||||||||||||||||||||||||||||||||||||
2004 - 2018 National Fire Incident Reporting System (NFIRS) incidents
- Incident types reported to NFIRS in DuBois, PA
- 54142.1%Fire
- 36528.4%Hazardous Condition
- 16612.9%Rescue & EMS
- 967.5%False Alarm
- 675.2%Service Call
- 362.8%Good Intent Call
- 70.5%Special Incident
- 50.4%Severe Weather
- 20.2%Overpressure Rupture
- Fire incident types reported to NFIRS in DuBois, PA
- 33762.3%Structure Fires
- 10319.0%Outside Fires
- 5910.9%Mobile Property/Vehicle Fires
- 427.8%Other
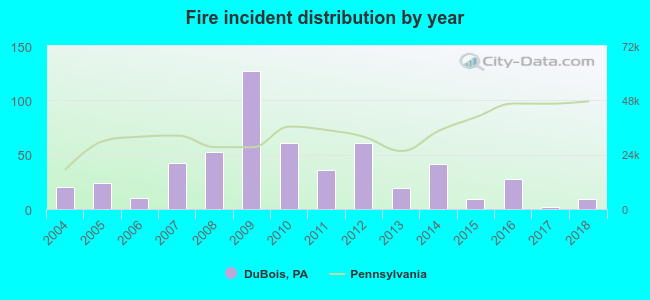 Based on the data from the years 2004 - 2018 the average number of fire incidents per year is 36. The highest number of reported fire incidents - 127 took place in 2009, and the least - 2 in 2017. The data has a decreasing trend.
The average number of yearly fire incidents per 10k residents in DuBois, PA compared to nearest cities:
(Note: Based on data for the last 3 years, including only cities with population 5,000 and above)
| DuBois: | 17.0 |
| Punxsutawney: | 79.8 |
| Clearfield: | 60.5 |
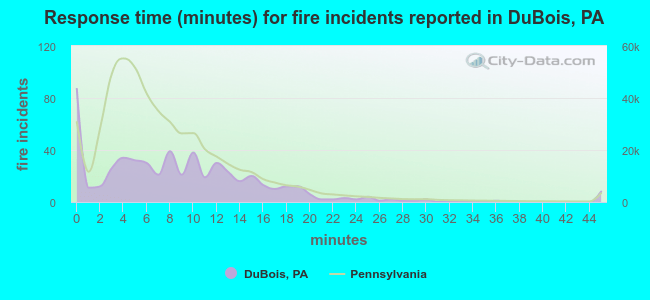 The median response time based on all reported fire incidents is 8 minutes. This is higher compared to the state median value.
The median response time in DuBois, PA compared to nearest cities:
(Note: Based on data for all years, including only cities with at least 500 fire incidents)
| DuBois: | 8 minutes |
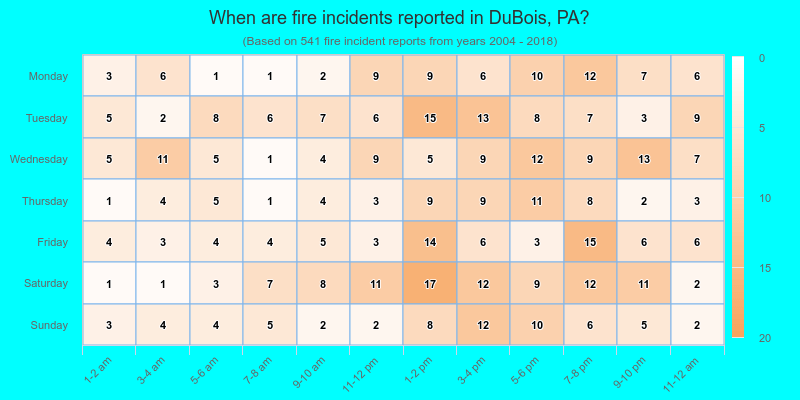
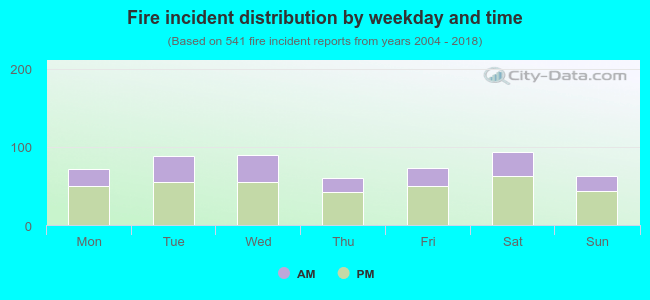 33.8% incidents where reported in the morning and 66.2% in the evening. The most fires (17.4%) took place on Saturday, and the least (11.1%) on Thursday.
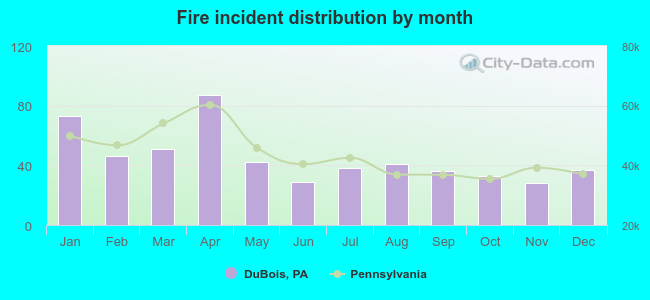 According to the 541 fire incident reports from years 2004 - 2018 most fires (16.1%) took place during April, and the least (5.2%) in November.
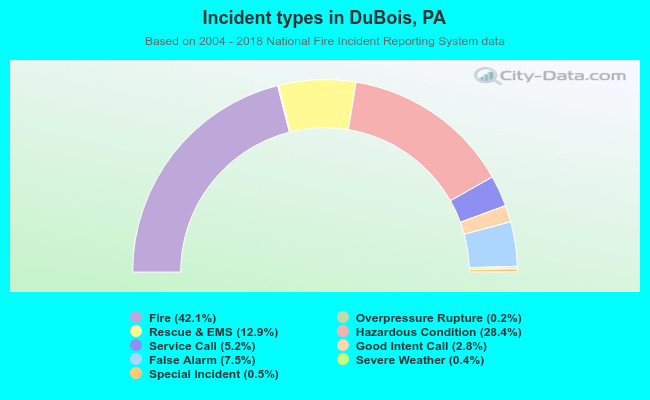 Out of all 1,285 cases reported during the years 2004 - 2018, the most belonged to the categories: Fire (42.1%), Hazardous Condition (28.4%), and Rescue & EMS (12.9%).
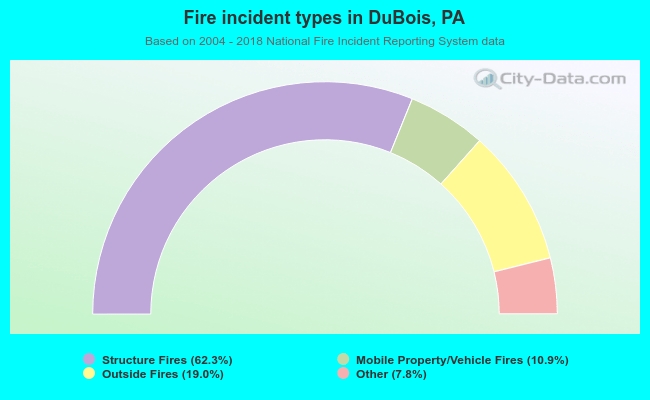 When looking into fire subcategories, the most incidents belonged to: Structure Fires (62.3%), and Outside Fires (19.0%).