Dubuque: Fire Incidents, Iowa (IA)
Where are fire incidents reported in Dubuque, IA
Something went wrong! Please refresh the page.
| Fire incidents reported | |
|---|---|
| Sreet name | Count |
| CENTRAL AVE | 218 |
| JACKSON ST | 174 |
| DODGE ST | 168 |
| LOCUST ST | 152 |
| MAIN ST | 132 |
| PENNSYLVANIA AVE | 130 |
| RHOMBERG AVE | 118 |
| WHITE ST | 116 |
| WASHINGTON ST | 110 |
| JOHN F KENNEDY RD | 104 |
| BLUFF ST | 102 |
| UNIVERSITY AVE | 102 |
| KAUFMANN AVE | 94 |
| ELM ST | 90 |
| ASBURY RD | 80 |
| LINCOLN AVE | 74 |
| GRANDVIEW AVE | 72 |
| KERPER BLVD | 72 |
| 3RD ST | 62 |
| WINDSOR AVE | 62 |
| HILLCREST RD | 60 |
| GARFIELD AVE | 58 |
| CLARKE DR | 56 |
| CASCADE RD | 54 |
| LORAS BLVD | 54 |
| 5TH ST | 50 |
| 16TH ST | 48 |
| PERU RD | 48 |
| ROOSEVELT ST | 48 |
| 11TH ST | 44 |
| Other | 482 |
2002 - 2018 National Fire Incident Reporting System (NFIRS) incidents
- Incident types reported to NFIRS in Dubuque, IA
- 22,77960.9%Rescue & EMS
- 5,73615.3%Hazardous Condition
- 3,2348.6%Fire
- 2,3436.3%False Alarm
- 2,1545.8%Service Call
- 9862.6%Good Intent Call
- 1010.3%Special Incident
- 490.1%Overpressure Rupture
- Fire incident types reported to NFIRS in Dubuque, IA
- 1,26239.0%Structure Fires
- 1,23238.1%Outside Fires
- 51716.0%Mobile Property/Vehicle Fires
- 2236.9%Other
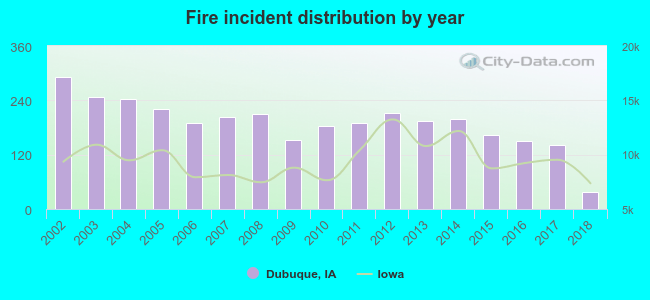 According to the data from the years 2002 - 2018 the average number of fire incidents per year is 190. The highest number of reported fires - 292 took place in 2002, and the least - 37 in 2018. The data has a declining trend.
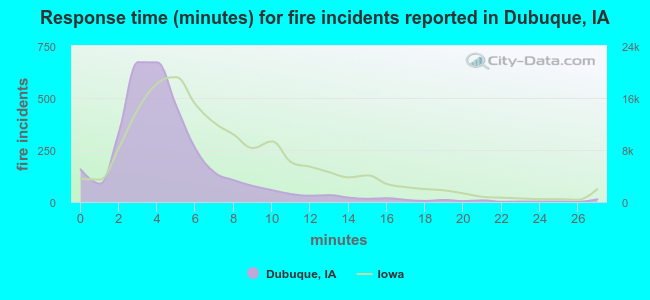 The median response time based on all reported fire incidents is 4 minutes. This is lower compared to the state median value.
The median response time in Dubuque, IA compared to nearest cities:
(Note: Based on data for all years, including only cities with at least 500 fire incidents)
| Dubuque: | 4 minutes |
| Maquoketa: | 9 minutes |
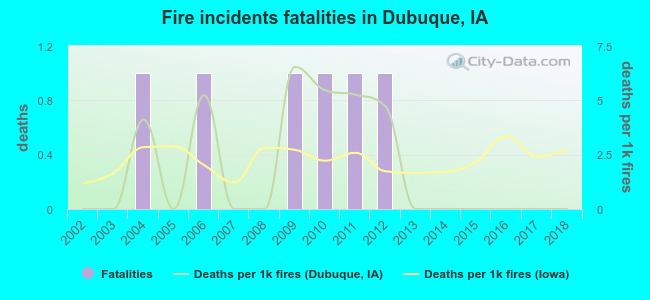 According to the data from the years 2002 - 2018 the average number of fire-related yearly deaths is 0. The highest number of deaths - 1 took place in 2004, and the lowest - 0 in 2002. The data has a constant trend.
The average number of fatalities per 1,000 fires is 2. This indicator was the highest - 7 in 2009, and the lowest 0 in 2002. The trend for deaths per 1,000 fires is declining. Compared to the state value the number of deaths per 1,000 fires is about the same.
According to the data from the years 2002 - 2018 the average number of fire-related yearly deaths is 0. The highest number of deaths - 1 took place in 2004, and the lowest - 0 in 2002. The data has a constant trend.
The average number of fatalities per 1,000 fires is 2. This indicator was the highest - 7 in 2009, and the lowest 0 in 2002. The trend for deaths per 1,000 fires is declining. Compared to the state value the number of deaths per 1,000 fires is about the same.Deaths per 1,000 incidents in Dubuque, IA compared to nearest cities:
(Note: Based on data for all years, including only cities with at least 2,500 fire incidents)
| Dubuque: | 1.9 |
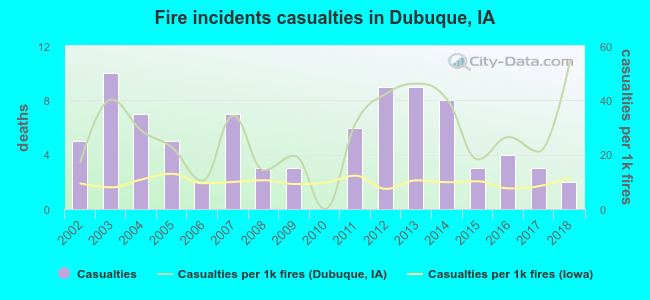 According to the reports from the years 2002 - 2018 the average number of fire-related casualties per year is 5. The highest number of injuries - 10 took place in 2003, and the lowest - 0 in 2010. The data has a decreasing trend.
The average number of injuries per 1,000 fires is 28. This indicator was the highest - 54 in 2018, and the lowest 0 in 2010. The trend for casualties per 1,000 fires is growing. Compared to the Iowa value the number of casualties per 1,000 fires is much higher.
According to the reports from the years 2002 - 2018 the average number of fire-related casualties per year is 5. The highest number of injuries - 10 took place in 2003, and the lowest - 0 in 2010. The data has a decreasing trend.
The average number of injuries per 1,000 fires is 28. This indicator was the highest - 54 in 2018, and the lowest 0 in 2010. The trend for casualties per 1,000 fires is growing. Compared to the Iowa value the number of casualties per 1,000 fires is much higher.Casualties per 1,000 incidents in Dubuque, IA compared to nearest cities:
(Note: Based on data for all years, including only cities with at least 500 fire incidents)
| Dubuque: | 26.6 |
| Maquoketa: | 0.0 |
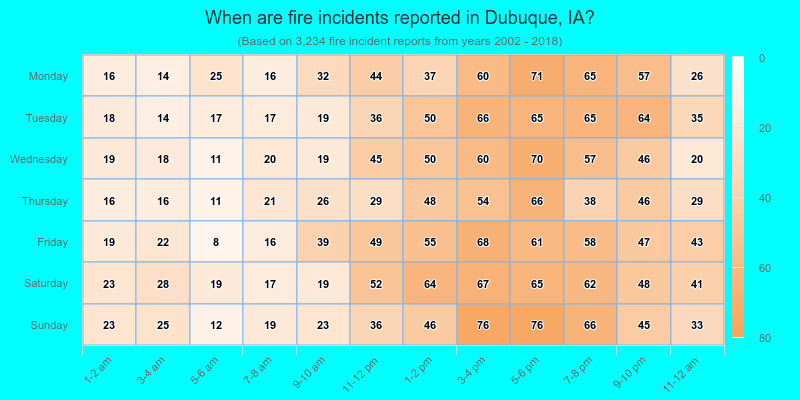
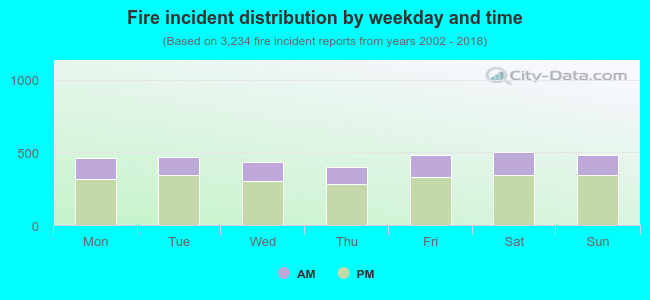 29.9% incidents where reported in the morning and 70.1% in the evening. The most fires (15.6%) took place on Saturday, and the least (12.4%) on Thursday.
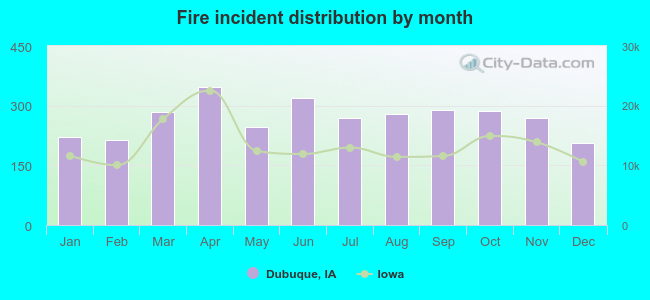 According to the 3,234 fire incidents from years 2002 - 2018 most fires (10.8%) took place during April, and the least (6.4%) in December.
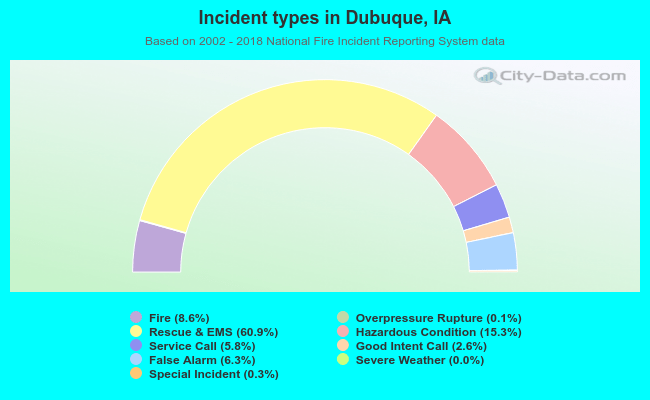 Out of all 37,393 cases reported during the years 2002 - 2018, the most belonged to the categories: Rescue & EMS (60.9%), Hazardous Condition (15.3%), and Fire (8.6%).
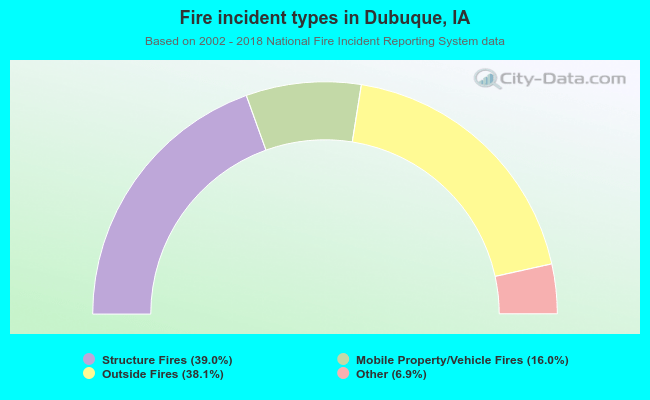 When looking into fire subcategories, the most reports belonged to: Structure Fires (39.0%), and Outside Fires (38.1%).