Duenweg: Fire Incidents, Missouri (MO)
Where are fire incidents reported in Duenweg, MO
Something went wrong! Please refresh the page.
|
| |||||||||||||||||||||||||||||||||||||||||||||||||||||||||||||||||||||||||||||||||||||||||||||||||||||||||||||
| Other | 23 | |||||||||||||||||||||||||||||||||||||||||||||||||||||||||||||||||||||||||||||||||||||||||||||||||||||||||||||
2002 - 2018 National Fire Incident Reporting System (NFIRS) incidents
- Incident types reported to NFIRS in Duenweg, MO
- 82347.9%Rescue & EMS
- 43125.1%Fire
- 20111.7%Good Intent Call
- 1186.9%Service Call
- 1086.3%Hazardous Condition
- 362.1%False Alarm
- Fire incident types reported to NFIRS in Duenweg, MO
- 21249.2%Outside Fires
- 13330.9%Structure Fires
- 7316.9%Mobile Property/Vehicle Fires
- 133.0%Other
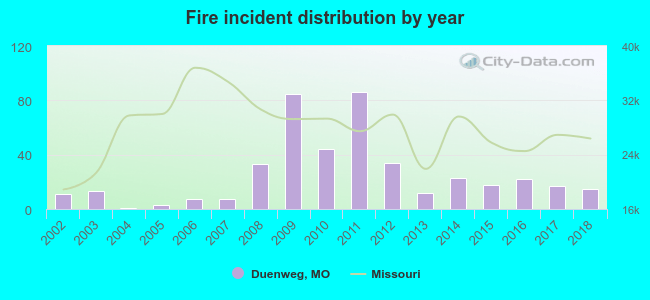 Based on the data from the years 2002 - 2018 the average number of fires per year is 25. The highest number of reported fires - 86 took place in 2011, and the least - 1 in 2004. The data has a growing trend.
 27.6% incidents where reported in the morning and 72.4% in the evening. The most fires (16.9%) took place on Wednesday, and the least (12.1%) on Monday.
 Based on the 431 fires from years 2002 - 2018 most fires (13.7%) took place during July, and the least (5.3%) in September.
 Out of all 1,719 cases reported during the years 2002 - 2018, the most belonged to the categories: Rescue & EMS (47.9%), Fire (25.1%), and Good Intent Call (11.7%).
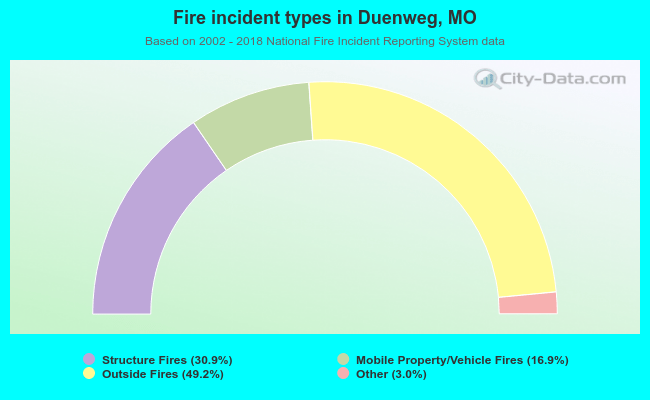 When looking into fire subcategories, the most incidents belonged to: Outside Fires (49.2%), and Structure Fires (30.9%).