| Fire incidents reported |
|---|
| Sreet name | Count |
|---|
| DOVER RD | 30 | | STATE ROUTE 93 HWY | 26 | | TRAIL BOTTOM ROAD RD | 24 | | CHESTNUT RIDGE RD | 22 | | STATE ROUTE 516 RD | 20 | | LOWER TRAIL RD | 18 | | STATE ROUTE 93 RT | 18 | | TRAIL BOTTOM RD | 18 | | WALNUT CREEK BOTTOM ROAD RD | 18 | | CEMENT BRIDGE RD | 16 | | CR 200 | 16 | | SENFF RD | 16 | | US 62 | 16 | | US 62 RD | 16 | | CEMENT BRIDGE ROAD RD | 14 | | KAYLOR ROAD RD | 14 | | TR 665 | 14 | | TR 669 | 14 | | CR 168 | 12 | | STATE ROUTE 516 NW | 12 | | WINESBURG RD | 12 | | PLEASANT HILL ROAD RD | 10 | | SR 93 | 10 | | TR 414 | 10 | | TR 659 | 10 |
| | | Fire incidents reported |
|---|
| Sreet name | Count |
|---|
| CAMP RD | 8 | | CHERRY RUN RD | 8 | | CHERRY RUN ROAD RD | 8 | | DUNDEE STRASBURG ROAD RD | 8 | | DURSTINE RD | 8 | | LEIHLEY HILL RD | 8 | | STATE ROUTE 516 | 8 | | TR 416 | 8 | | TR 664 | 8 | | ZUERCHER RD | 8 | | CEMENT BRIDGE RD | 6 | | CEMENT BRIDGE RD NW | 6 | | CR 160 | 6 | | DOVER RDUS 250 RD | 6 | | HARDY DRIVE RD | 6 | | KOHR RD | 6 | | KOHR RD | 6 | | KOHR ROAD RD | 6 | | NEBRASKA RD | 6 | | PLEASANT HILL RD | 6 | | PLEASENT HILL RD | 6 | | ST RT 93 | 6 | | STATE ROUTE 93 NW | 6 | | TR 412 | 6 | | |
|
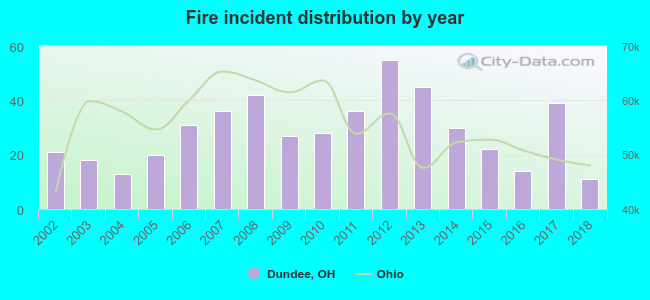 Based on the data from the years 2002 - 2018 the average number of fires per year is 29. The highest number of fires - 55 took place in 2012, and the least - 11 in 2018. The data has a declining trend.
 28.3% incidents where reported in the morning and 71.7% in the evening. The most fires (18.6%) took place on Thursday, and the least (9.8%) on Wednesday.
 According to the 488 incident reports from years 2002 - 2018 most fires (13.1%) took place during April, and the least (4.5%) in September.
 Out of all 1,514 cases reported during the years 2002 - 2018, the most belonged to the categories: Rescue & EMS (38.7%), Fire (32.2%), and Hazardous Condition (18.0%).
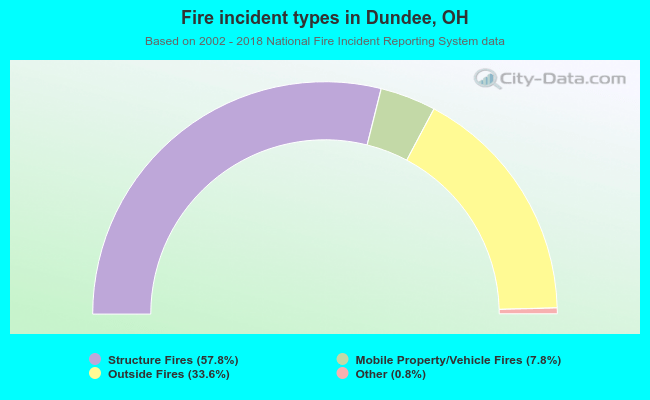 When looking into fire subcategories, the most incidents belonged to: Structure Fires (57.8%), and Outside Fires (33.6%).