| Fire incidents reported |
|---|
| Sreet name | Count |
|---|
| 500 | 8 | | STATE ROAD 250 | 8 | | STATE ROAD 7 | 8 | | BREEDING ROAD | 6 | | 1000 | 4 | | 10589 NW FRONT ST | 4 | | 450 | 4 | | 4675 700E | 4 | | EAST FRONT ST | 4 | | HWY. #7 @ DUPONT | 4 | | MAIN | 4 | | MORGAN TRACE | 4 | | MORGANS TRACE | 4 | | SR 7 | 4 | | 10395 N. WEST FRONT ??ST | 2 | | 10401 N SPARKMAN LN | 2 | | 10410 N. SPARKMAN LN. | 2 | | 10465 N SPARKMAN LN2 | 2 | | 1050 NORTH | 2 | | 1050 NORTH &JOHN DEERE RD | 2 | | 10525 W. FRONT ST. | 2 | | 10553 N. REYNOLDS RD. | 2 | | 10557 SPARKMAN LN. LOT ?? | 2 | | 10589 N.W. FRONT ST. | 2 | | 10610 N. REYNOLDS ??RF | 2 |
| | | Fire incidents reported |
|---|
| Sreet name | Count |
|---|
| 10631 N. 700 W | 2 | | 10662 N. REYNOLDS RD. | 2 | | 10707 N. REYNOLDS RD | 2 | | 10719 N. REYNOLDS RD | 2 | | 10917 N. REYNOLDS RD. | 2 | | 10999 N. REYNOLDS RD. | 2 | | 11163 N. REYNOLDS RD | 2 | | 11265 N 700 W. | 2 | | 1200 | 2 | | 1650 S CR 400 E | 2 | | 17345 E CR 150 S | 2 | | 200 E NORTH OF 500S | 2 | | 2225 S 600 E | 2 | | 2561 N 900 N | 2 | | 2730 E CR 500 S | 2 | | 300 | 2 | | 3350 E. CR. 500 | 2 | | 3490 S. 500 E. | 2 | | 3550 E 150 S | 2 | | 3560 N 500E | 2 | | 3600 S 500 S | 2 | | 406 S 600E | 2 | | 4065 S. 600 E | 2 | | 4076 W 700 N | 2 | | 4130 W. 1100 N | 2 |
|
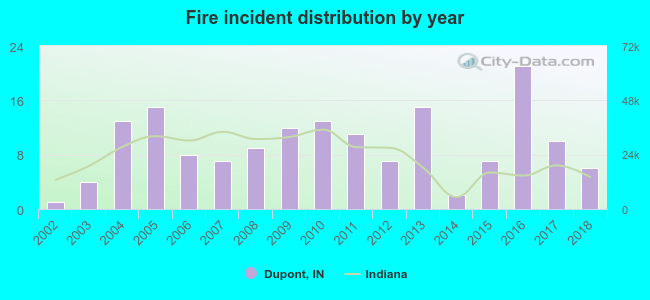 According to the data from the years 2002 - 2018 the average number of fire incidents per year is 9. The highest number of fires - 21 took place in 2016, and the least - 1 in 2002. The data has a growing trend.
 31.7% incidents where reported in the morning and 68.3% in the evening. The most fires (19.3%) took place on Tuesday, and the least (9.9%) on Wednesday.
 According to the 161 incident reports from years 2002 - 2018 most fires (14.3%) took place during March, and the least (1.2%) in May.
 Out of all 310 cases reported during the years 2002 - 2018, the most belonged to the categories: Fire (51.9%), Overpressure Rupture (28.7%), and Service Call (9.7%).
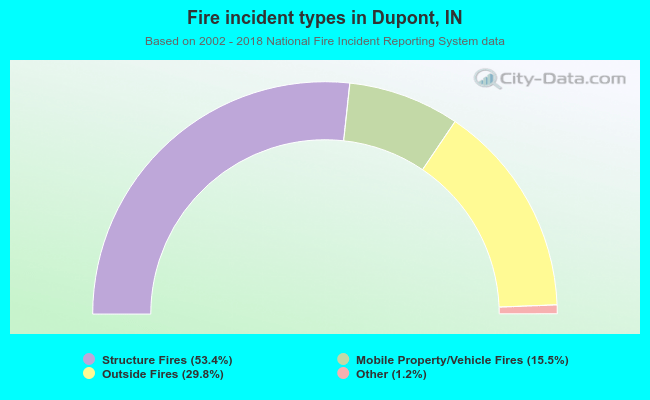 When looking into fire subcategories, the most reports belonged to: Structure Fires (53.4%), and Outside Fires (29.8%).