Duryea: Fire Incidents, Pennsylvania (PA)
Where are fire incidents reported in Duryea, PA
Something went wrong! Please refresh the page.
|
| |||||||||||||||||||||||||||||||||||||||||||||||||||||||||||||||||||||||||||||||||||||||||||||||||||||||||||||
2004 - 2018 National Fire Incident Reporting System (NFIRS) incidents
- Incident types reported to NFIRS in Duryea, PA
- 45825.4%Fire
- 43624.1%Hazardous Condition
- 28315.7%Good Intent Call
- 21211.7%Service Call
- 18210.1%Rescue & EMS
- 1759.7%False Alarm
- 522.9%Severe Weather
- 40.2%Overpressure Rupture
- 40.2%Special Incident
- Fire incident types reported to NFIRS in Duryea, PA
- 21947.8%Structure Fires
- 18841.0%Outside Fires
- 408.7%Mobile Property/Vehicle Fires
- 112.4%Other
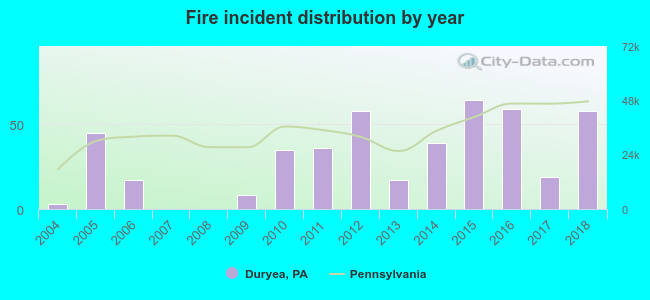 According to the data from the years 2004 - 2018 the average number of fires per year is 31. The highest number of reported fire incidents - 64 took place in 2015, and the least - 0 in 2007. The data has a growing trend.
 25.5% incidents where reported in the morning and 74.5% in the evening. The most fires (18.1%) took place on Tuesday, and the least (10.9%) on Thursday.
 According to the 458 fire incidents from years 2004 - 2018 most fires (15.5%) took place during April, and the least (3.7%) in December.
 Out of all 1,806 cases reported during the years 2004 - 2018, the most belonged to the categories: Fire (25.4%), Hazardous Condition (24.1%), and Good Intent Call (15.7%).
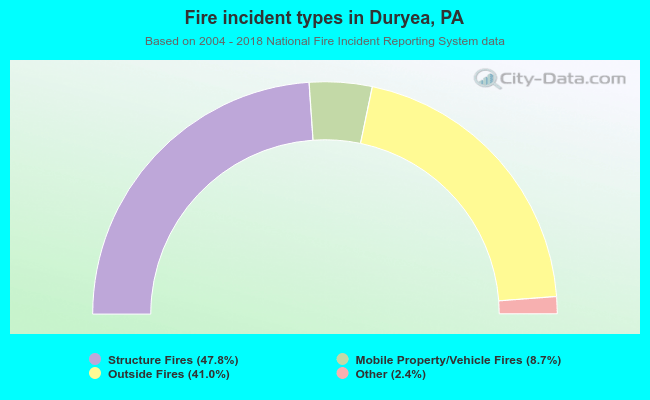 When looking into fire subcategories, the most reports belonged to: Structure Fires (47.8%), and Outside Fires (41.0%).