Eagle Butte: Fire Incidents, South Dakota (SD)
Where are fire incidents reported in Eagle Butte, SD
Something went wrong! Please refresh the page.
|
| |||||||||||||||||||||||||||||||||||||||||||||||||||||||||||||||||||||||||||||||||||||||||||||||||||||||||||||
| Other | 385 | |||||||||||||||||||||||||||||||||||||||||||||||||||||||||||||||||||||||||||||||||||||||||||||||||||||||||||||
2002 - 2018 National Fire Incident Reporting System (NFIRS) incidents
- Incident types reported to NFIRS in Eagle Butte, SD
- 84584.7%Fire
- 848.4%Good Intent Call
- 272.7%Hazardous Condition
- 232.3%False Alarm
- 90.9%Service Call
- 70.7%Rescue & EMS
- 30.3%Severe Weather
- Fire incident types reported to NFIRS in Eagle Butte, SD
- 38145.1%Outside Fires
- 19423.0%Other
- 17320.5%Structure Fires
- 9711.5%Mobile Property/Vehicle Fires
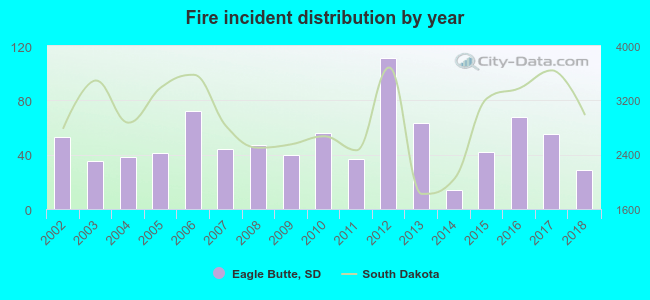 According to the data from the years 2002 - 2018 the average number of fire incidents per year is 50. The highest number of fire incidents - 111 took place in 2012, and the least - 14 in 2014. The data has a declining trend.
 The median response time based on all reported fire incidents is 2 minutes. This is much lower compared to the South Dakota median value.
The median response time in Eagle Butte, SD compared to nearest cities:
(Note: Based on data for all years, including only cities with at least 500 fire incidents)
| Eagle Butte: | 2 minutes |
| Pierre: | 4 minutes |
 24.5% incidents where reported in the morning and 75.5% in the evening. The most fires (17.8%) took place on Sunday, and the least (12.5%) on Wednesday.
 According to the 845 fires from years 2002 - 2018 most fires (28.4%) took place during July, and the least (3.0%) in February.
 Out of all 998 cases reported during the years 2002 - 2018, the most belonged to the categories: Fire (84.7%), Service Call (8.4%), and Rescue & EMS (2.7%).
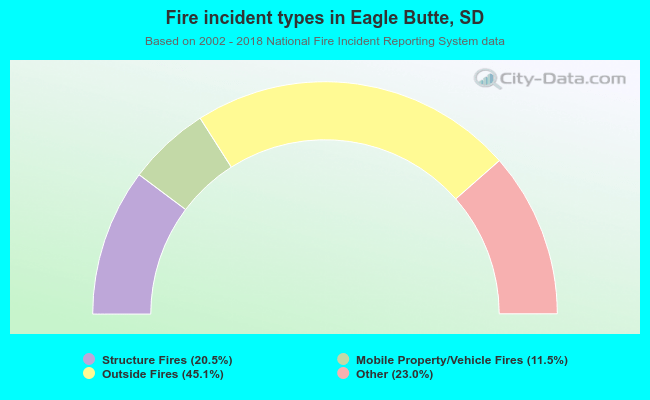 When looking into fire subcategories, the most reports belonged to: Outside Fires (45.1%), and Other (23.0%).