Earlham: Fire Incidents, Iowa (IA)
Where are fire incidents reported in Earlham, IA
Something went wrong! Please refresh the page.
|
| |||||||||||||||||||||||||||||||||||||||||||||||||||||||||||||||||||||||||||||||||||||||||||||||||||||||||||||
2002 - 2018 National Fire Incident Reporting System (NFIRS) incidents
- Incident types reported to NFIRS in Earlham, IA
- 24243.4%Fire
- 12622.6%Rescue & EMS
- 7914.2%Good Intent Call
- 478.4%Hazardous Condition
- 427.5%Severe Weather
- 152.7%False Alarm
- 40.7%Service Call
- 10.2%Overpressure Rupture
- 10.2%Special Incident
- Fire incident types reported to NFIRS in Earlham, IA
- 14760.7%Outside Fires
- 4719.4%Structure Fires
- 4016.5%Mobile Property/Vehicle Fires
- 83.3%Other
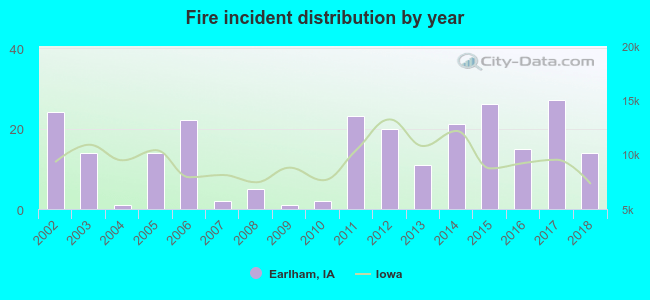 According to the data from the years 2002 - 2018 the average number of fires per year is 14. The highest number of fires - 27 took place in 2017, and the least - 1 in 2004. The data has a dropping trend.
 25.2% incidents where reported in the morning and 74.8% in the evening. The most fires (17.4%) took place on Saturday, and the least (11.2%) on Wednesday.
 According to the 242 fire incident reports from years 2002 - 2018 most fires (15.7%) took place during March, and the least (4.5%) in January.
 Out of all 557 cases reported during the years 2002 - 2018, the most belonged to the categories: Fire (43.4%), Rescue & EMS (22.6%), and Good Intent Call (14.2%).
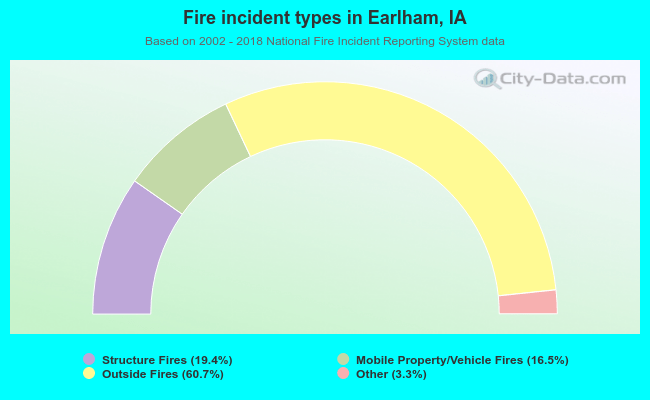 When looking into fire subcategories, the most reports belonged to: Outside Fires (60.7%), and Structure Fires (19.4%).