Earlville: Fire Incidents, Illinois (IL)
Where are fire incidents reported in Earlville, IL
Something went wrong! Please refresh the page.
|
| |||||||||||||||||||||||||||||||||||||||||||||||||||||||||||||||||||||||||||||||||||||||||||||||||||||||||||||
| Other | 41 | |||||||||||||||||||||||||||||||||||||||||||||||||||||||||||||||||||||||||||||||||||||||||||||||||||||||||||||
2002 - 2018 National Fire Incident Reporting System (NFIRS) incidents
- Incident types reported to NFIRS in Earlville, IL
- 27342.3%Fire
- 22134.2%Rescue & EMS
- 7211.1%Hazardous Condition
- 355.4%Service Call
- 203.1%Good Intent Call
- 182.8%False Alarm
- 60.9%Severe Weather
- 10.2%Special Incident
- Fire incident types reported to NFIRS in Earlville, IL
- 11843.2%Structure Fires
- 11040.3%Outside Fires
- 4115.0%Mobile Property/Vehicle Fires
- 41.5%Other
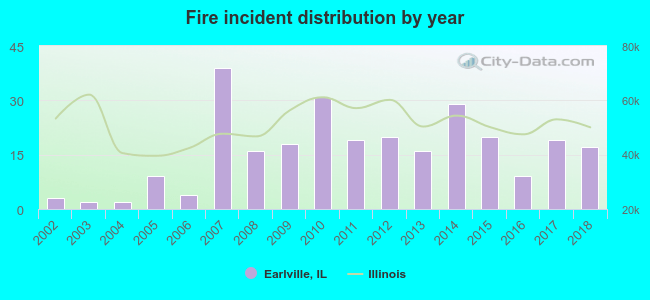 According to the data from the years 2002 - 2018 the average number of fires per year is 16. The highest number of reported fire incidents - 39 took place in 2007, and the least - 2 in 2003. The data has a rising trend.
 33.0% incidents where reported in the morning and 67.0% in the evening. The most fires (17.6%) took place on Tuesday, and the least (11.4%) on Friday.
 Based on the 273 incident reports from years 2002 - 2018 most fires (13.2%) took place during April, and the least (4.0%) in August.
 Out of all 646 cases reported during the years 2002 - 2018, the most belonged to the categories: Fire (42.3%), Overpressure Rupture (34.2%), and Rescue & EMS (11.1%).
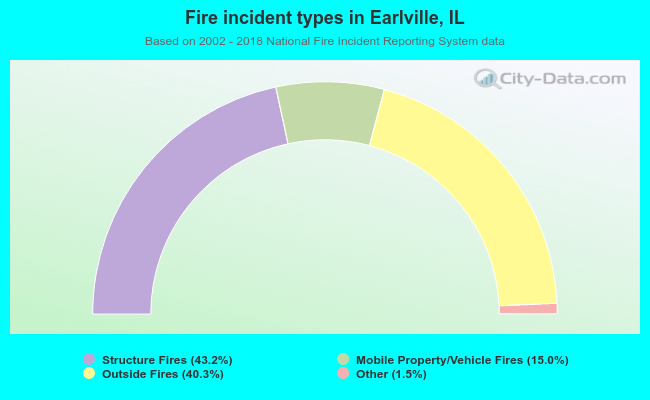 When looking into fire subcategories, the most reports belonged to: Structure Fires (43.2%), and Outside Fires (40.3%).