| Fire incidents reported |
|---|
| Sreet name | Count |
|---|
| S MAIN ST | 24 | | RIVER RD | 20 | | MAIN ST | 18 | | EARLVILLE RD | 16 | | E MAIN ST | 14 | | N MAIN ST | 14 | | W MAIN ST | 14 | | FAYETTE ST | 12 | | LEBANON RD | 12 | | BORDEN RD | 10 | | MAIN | 10 | | WEST MAIN ST | 8 | | WEST MAIN STREET | 8 | | STODDARD | 6 | | 49 WEST MAIN ST | 4 | | ABBOTT | 4 | | CLYDE ST | 4 | | CRAIN LAKE RD | 4 | | CRAINE LAKE RD | 4 | | DEEP SPRINGS RD | 4 | | EAST MAIN ST | 4 | | EAST MAIN STREET | 4 | | FAYETTE | 4 | | MILL ST | 4 | | NORTH MAIN ST | 4 |
| | | Fire incidents reported |
|---|
| Sreet name | Count |
|---|
| NORTH MAIN STREET | 4 | | PRESTON HILL RD | 4 | | REESE RD | 4 | | TAYLOR | 4 | | TAYLOR AV | 4 | | TAYLOR AVE | 4 | | WILLEY RD | 4 | | 10 MADISON STREET | 2 | | 1003 DEEP SPRINGS RD | 2 | | 119 RT 12 B | 2 | | 1233 RIVER ROAD | 2 | | 34 EAST MAIN STREET | 2 | | 45 WEST AMIN STREET | 2 | | 45 WEST MAIN STREET | 2 | | 5633 LEBANON ROAD | 2 | | ABBOT AVE | 2 | | ABBOTT AV | 2 | | ABBOTT AVE | 2 | | ALBRO RD | 2 | | BASTIAN | 2 | | CASTLE HILL RD | 2 | | CLYDE STREET | 2 | | COUNTY RD 22 | 2 | | COUNTY ROAD 14 | 2 | | |
|
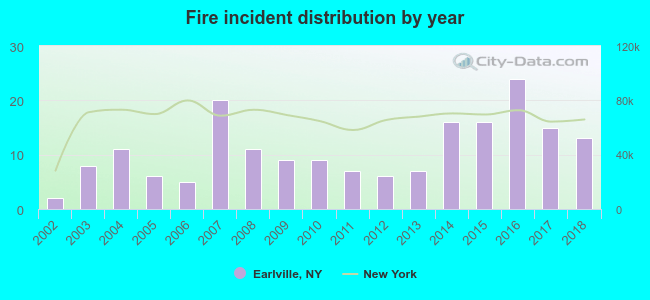 According to the data from the years 2002 - 2018 the average number of fires per year is 11. The highest number of reported fires - 24 took place in 2016, and the least - 2 in 2002. The data has a rising trend.
 35.7% incidents where reported in the morning and 64.3% in the evening. The most fires (23.2%) took place on Friday, and the least (4.3%) on Sunday.
 According to the 185 incident reports from years 2002 - 2018 most fires (20.5%) took place during February, and the least (2.7%) in December.
 Out of all 1,183 cases reported during the years 2002 - 2018, the most belonged to the categories: Rescue & EMS (58.6%), Fire (15.6%), and Hazardous Condition (13.4%).
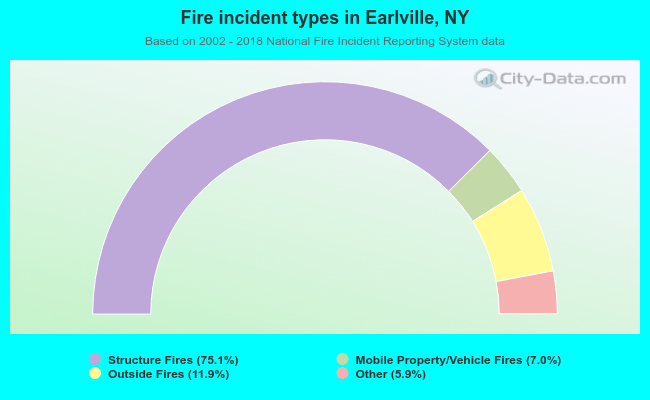 When looking into fire subcategories, the most incidents belonged to: Structure Fires (75.1%), and Outside Fires (11.9%).