East Hampton: Fire Incidents, Connecticut (CT)
Where are fire incidents reported in East Hampton, CT
Something went wrong! Please refresh the page.
| Fire incidents reported | |
|---|---|
| Sreet name | Count |
| MAIN ST | 36 |
| SMITH ST | 36 |
| COLCHESTER AVE | 34 |
| EAST HIGH ST | 30 |
| WOPOWOG RD | 26 |
| MOTT HILL RD | 24 |
| MIDDLE HADDAM RD | 20 |
| WEST HIGH ST | 20 |
| YOUNG ST | 20 |
| SOUTH MAIN ST | 18 |
| FLANDERS RD | 16 |
| FLANNERY ROW | 16 |
| NORTH MAIN ST | 16 |
| COLCHESTER AVE | 14 |
| HOG HILL RD | 14 |
| HIGH ST | 12 |
| MAPLE ST | 12 |
| MOODUS RD | 12 |
| NORTH MAPLE ST | 12 |
| OAKUM DOCK RD | 12 |
| CHESTNUT HILL RD | 10 |
| EAST HIGH ST | 10 |
| HURD PARK RD | 10 |
| MIDDLETOWN AVE | 10 |
| SUMMIT ST | 10 |
| BAY RD | 8 |
| BEVIN BLVD | 8 |
| CLARK HILL RD | 8 |
| CONE RD | 8 |
| GULF RD | 8 |
| Other | 206 |
2002 - 2018 National Fire Incident Reporting System (NFIRS) incidents
- Incident types reported to NFIRS in East Hampton, CT
- 1,05735.5%Hazardous Condition
- 69623.4%Fire
- 47415.9%Rescue & EMS
- 37712.7%False Alarm
- 2026.8%Good Intent Call
- 1615.4%Service Call
- 50.2%Special Incident
- Fire incident types reported to NFIRS in East Hampton, CT
- 32446.6%Structure Fires
- 25436.5%Outside Fires
- 7410.6%Mobile Property/Vehicle Fires
- 446.3%Other
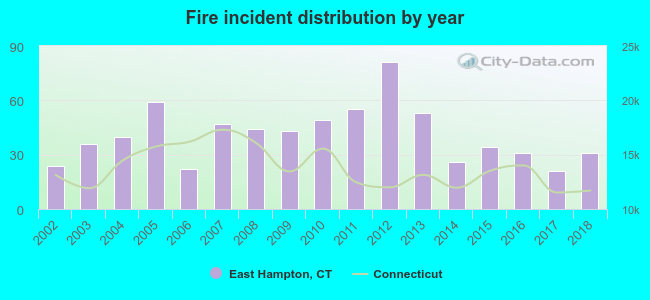 According to the data from the years 2002 - 2018 the average number of fires per year is 41. The highest number of fires - 81 took place in 2012, and the least - 21 in 2017. The data has an increasing trend.
 The median response time based on all reported fire incidents is 6 minutes. This is close to the state median value.
The median response time in East Hampton, CT compared to nearest cities:
(Note: Based on data for all years, including only cities with at least 500 fire incidents)
| East Hampton: | 6 minutes |
| Portland: | 5 minutes |
| East Haddam: | 11 minutes |
| Colchester: | 8 minutes |
| Middletown: | 5 minutes |
| Cromwell: | 7 minutes |
| Glastonbury: | 6 minutes |
| Rocky Hill: | 7 minutes |
| Wethersfield: | 7 minutes |
 According to the reports from the years 2002 - 2018 the average number of fire-related yearly casualties is 0. The highest number of casualties - 1 took place in 2002, and the lowest - 0 in 2003. The data has a declining trend.
The average number of injuries per 1,000 fires is 5. This indicator was the highest - 42 in 2002, and the lowest 0 in 2003. The trend for injuries per 1,000 incidents is dropping. Compared to the Connecticut value the number of casualties per 1,000 fires is much lower.
According to the reports from the years 2002 - 2018 the average number of fire-related yearly casualties is 0. The highest number of casualties - 1 took place in 2002, and the lowest - 0 in 2003. The data has a declining trend.
The average number of injuries per 1,000 fires is 5. This indicator was the highest - 42 in 2002, and the lowest 0 in 2003. The trend for injuries per 1,000 incidents is dropping. Compared to the Connecticut value the number of casualties per 1,000 fires is much lower.Casualties per 1,000 incidents in East Hampton, CT compared to nearest cities:
(Note: Based on data for all years, including only cities with at least 500 fire incidents)
| East Hampton: | 4.3 |
| Portland: | 0.0 |
| East Haddam: | 0.0 |
| Colchester: | 12.9 |
| Middletown: | 8.3 |
| Cromwell: | 5.4 |
| Glastonbury: | 16.7 |
| Rocky Hill: | 7.2 |
| Wethersfield: | 21.5 |
 28.9% incidents where reported in the morning and 71.1% in the evening. The most fires (17.1%) took place on Saturday, and the least (11.5%) on Monday.
 According to the 696 fire incident reports from years 2002 - 2018 most fires (13.9%) took place during April, and the least (5.9%) in June.
 Out of all 2,976 cases reported during the years 2002 - 2018, the most belonged to the categories: Hazardous Condition (35.5%), Fire (23.4%), and Rescue & EMS (15.9%).
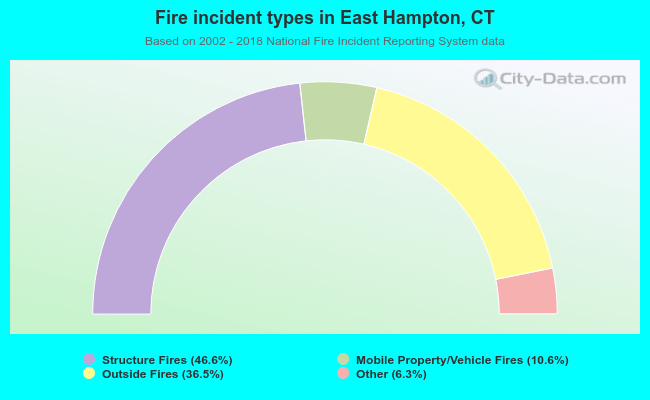 When looking into fire subcategories, the most reports belonged to: Structure Fires (46.6%), and Outside Fires (36.5%).