| Fire incidents reported |
|---|
| Sreet name | Count |
|---|
| NY ROUTE 66 RT | 24 | | CENTRAL NASSAU RD | 16 | | TSATSAWASSA LAKE RD | 16 | | TOWN GARAGE RD | 12 | | DUNHAM HOLLOW RD | 10 | | NY ROUTE 66 | 10 | | TOTEM LODGE RD | 8 | | NY ROUTE 20 | 6 | | DUNHAM HOLLOW | 4 | | DUSENBERRY HILL RD | 4 | | HOAGS CORNERS RD | 4 | | MILLERS CORNERS RD | 4 | | NY 66 RT | 4 | | RADLEY RD | 4 | | ROUTE 20 | 4 | | SMITH HILL RD | 4 | | TABORTON | 4 | | ALPS MOUNTAIN RD | 2 | | ANDREWS LN | 2 | | BEST LUTHER FD | 2 | | BLISS SCHOOLHOUSE RD | 2 | | BRAINARD STATION RD | 2 | | BURDEN LAKE | 2 | | CHINA HILL RD | 2 | | CLARKS CHAPEL | 2 |
| | | Fire incidents reported |
|---|
| Sreet name | Count |
|---|
| CLARKS CHAPEL RD | 2 | | DE VOE DR | 2 | | GARDNER HILL RD | 2 | | HOAGS CORNER RD STS | 2 | | HOAGS CORNERS ROAD | 2 | | HOGARTY RD | 2 | | KROUNER RD | 2 | | LORDS HILL | 2 | | MEAD RD | 2 | | NASSAU - HOAGS CORNERS RD | 2 | | NASSAU AVERILL PARK RD | 2 | | NASSAU RD | 2 | | NY 20 | 2 | | NY ROUTE 43 | 2 | | NY RT 43 | 2 | | OLD MILL POND RD | 2 | | RADLEY | 2 | | ROUTE 66 | 2 | | ROUTE 66 N | 2 | | RT 66 | 2 | | TABORTON RD | 2 | | THAIS RD | 2 | | TOTEM LODGE | 2 | | TSATSAWASSA LAKE ROAD | 2 | | |
|
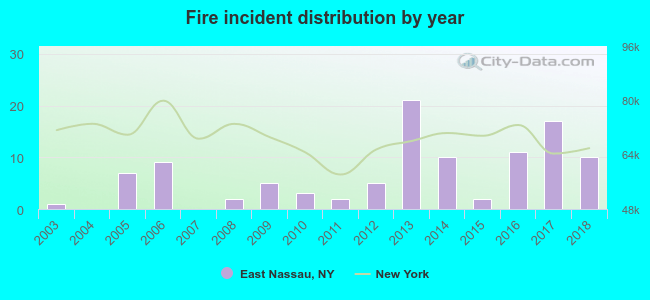 According to the data from the years 2003 - 2018 the average number of fire incidents per year is 7. The highest number of reported fires - 21 took place in 2013, and the least - 0 in 2004. The data has a growing trend.
 25.7% incidents where reported in the morning and 74.3% in the evening. The most fires (19.0%) took place on Monday, and the least (9.5%) on Tuesday.
 According to the 105 incident reports from years 2003 - 2018 most fires (24.8%) took place during April, and the least (4.8%) in February.
 Out of all 643 cases reported during the years 2003 - 2018, the most belonged to the categories: Overpressure Rupture (44.8%), Rescue & EMS (25.5%), and Fire (16.3%).
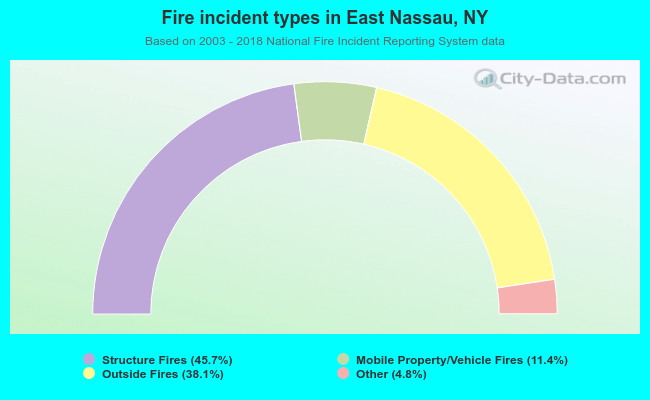 When looking into fire subcategories, the most incidents belonged to: Structure Fires (45.7%), and Outside Fires (38.1%).