East St. Louis: Fire Incidents, Illinois (IL)
Where are fire incidents reported in East St. Louis, IL
Something went wrong! Please refresh the page.
| Fire incidents reported | |
|---|---|
| Sreet name | Count |
| STATE ST | 118 |
| MARKET AVE | 88 |
| BOND AVE | 82 |
| MISSOURI AVE | 80 |
| MCCASLAND AVE | 78 |
| ST. LOUIS AVE | 76 |
| GATY AVE | 62 |
| ST. CLAIR AVE | 58 |
| M.L.K. DR | 56 |
| CONVERSE AVE | 54 |
| TRENDLEY AVE | 48 |
| BROADWAY AVE | 46 |
| 6TH ST | 44 |
| CLEVELAND AVE | 42 |
| 44TH ST | 40 |
| TUDOR AVE | 40 |
| OHIO AVE | 36 |
| 23RD ST | 34 |
| 37TH ST | 34 |
| 72ND ST | 34 |
| 46TH ST | 32 |
| SUMMIT AVE | 30 |
| 22ND ST | 28 |
| 25TH ST | 28 |
| 71ST ST | 28 |
| DIVISION AVE | 28 |
| RUSSELL AVE | 28 |
| 36TH ST | 26 |
| BELMONT AVE | 26 |
| CASEYVILLE AVE | 26 |
| Other | 285 |
2003 - 2011 National Fire Incident Reporting System (NFIRS) incidents
- Incident types reported to NFIRS in East St. Louis, IL
- 1,71586.7%Fire
- 23511.9%Hazardous Condition
- 201.0%Service Call
- 50.3%Good Intent Call
- Fire incident types reported to NFIRS in East St. Louis, IL
- 83448.6%Outside Fires
- 54932.0%Structure Fires
- 31918.6%Mobile Property/Vehicle Fires
- 130.8%Other
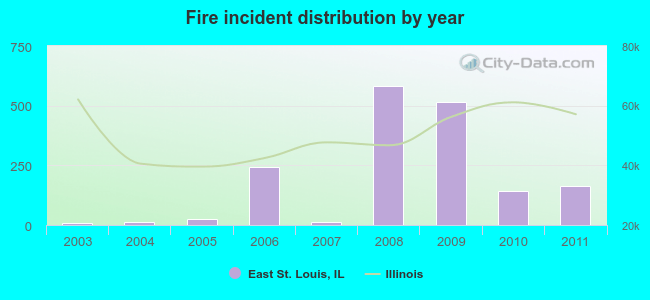 According to the data from the years 2003 - 2011 the average number of fire incidents per year is 190. The highest number of reported fire incidents - 584 took place in 2008, and the least - 10 in 2003. The data has a rising trend.
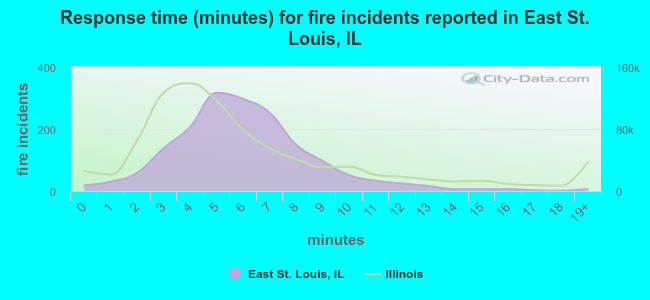 The median response time based on all reported fire incidents is 6 minutes. This is comparable to the state median value.
The median response time in East St. Louis, IL compared to nearest cities:
(Note: Based on data for all years, including only cities with at least 500 fire incidents)
| East St. Louis: | 6 minutes |
| Washington Park: | 5 minutes |
| Alorton: | 5 minutes |
| Centreville: | 7 minutes |
| Cahokia: | 7 minutes |
| Madison: | 6 minutes |
| Caseyville: | 6 minutes |
| Granite City: | 3 minutes |
| Fairview Heights: | 5 minutes |
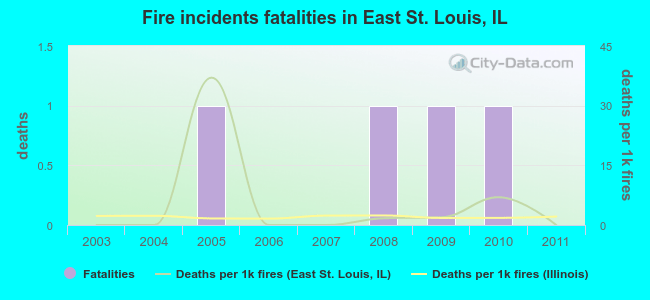 According to the reports from the years 2003 - 2011 the average number of fire-related yearly deaths is 0. The highest number of reported deaths - 1 took place in 2005, and the lowest - 0 in 2003. The data has a constant trend.
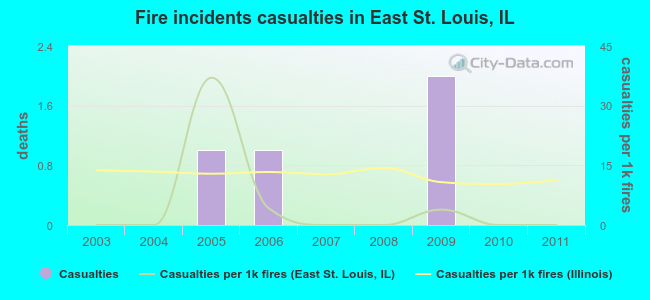 Based on the reports from the years 2003 - 2011 the average number of fire-related yearly casualties is 0. The highest number of reported injuries - 2 took place in 2009, and the lowest - 0 in 2003. The data has a constant trend.
The average number of casualties per 1,000 fires is 5. This indicator was the highest - 37 in 2005, and the lowest 0 in 2003. The trend for casualties per 1,000 fire incidents is constant. Compared to the state value the number of injuries per 1,000 incidents is much lower.
Based on the reports from the years 2003 - 2011 the average number of fire-related yearly casualties is 0. The highest number of reported injuries - 2 took place in 2009, and the lowest - 0 in 2003. The data has a constant trend.
The average number of casualties per 1,000 fires is 5. This indicator was the highest - 37 in 2005, and the lowest 0 in 2003. The trend for casualties per 1,000 fire incidents is constant. Compared to the state value the number of injuries per 1,000 incidents is much lower.Casualties per 1,000 incidents in East St. Louis, IL compared to nearest cities:
(Note: Based on data for all years, including only cities with at least 500 fire incidents)
| East St. Louis: | 2.3 |
| Washington Park: | 3.0 |
| Alorton: | 0.0 |
| Centreville: | 0.0 |
| Cahokia: | 9.4 |
| Madison: | 2.0 |
| Caseyville: | 1.5 |
| Granite City: | 19.8 |
| Fairview Heights: | 17.3 |
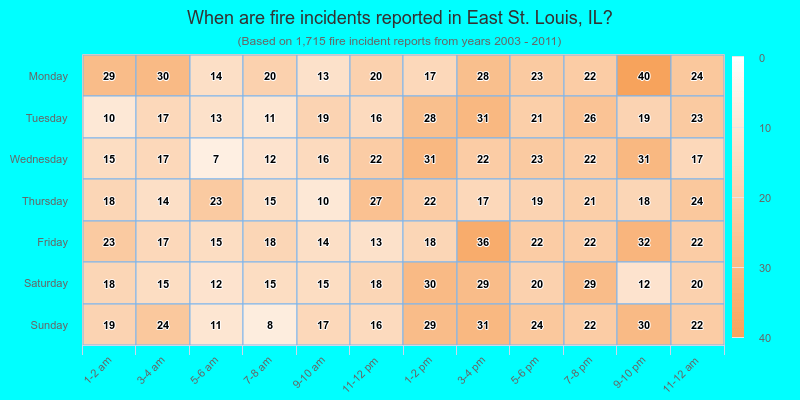
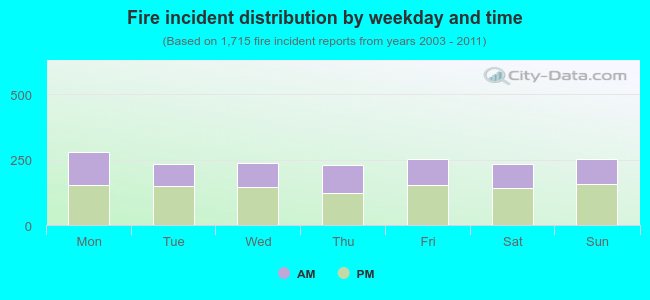 40.6% incidents where reported in the morning and 59.4% in the evening. The most fires (16.3%) took place on Monday, and the least (13.3%) on Thursday.
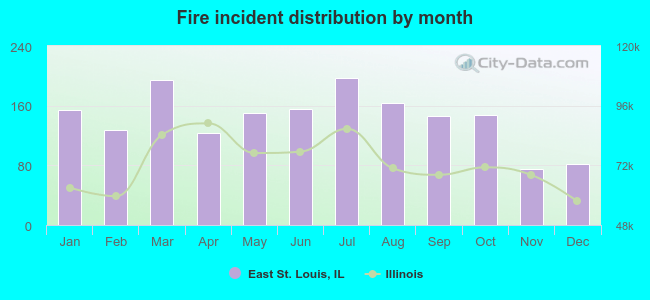 According to the 1,715 reports from years 2003 - 2011 most fires (11.5%) took place during July, and the least (4.4%) in November.
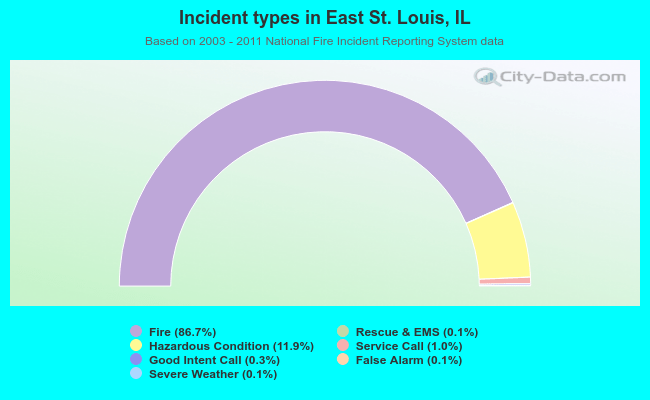 Out of all 1,978 cases reported during the years 2003 - 2011, the most belonged to the categories: Fire (86.7%), Rescue & EMS (11.9%), and Hazardous Condition (1.0%).
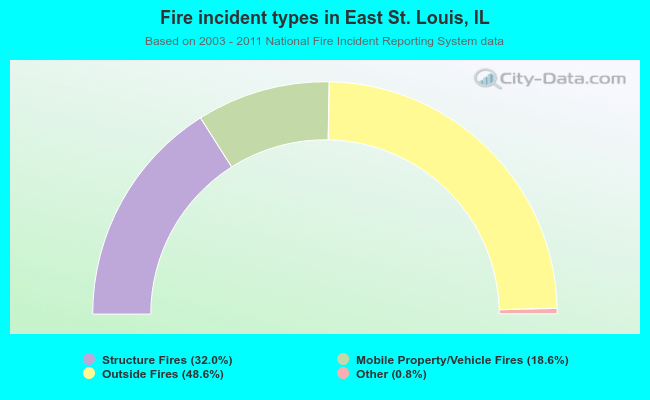 When looking into fire subcategories, the most incidents belonged to: Outside Fires (48.6%), and Structure Fires (32.0%).