Edna: Fire Incidents, Kansas (KS)
Where are fire incidents reported in Edna, KS
Something went wrong! Please refresh the page.
|
| |||||||||||||||||||||||||||||||||||||||||||||||||||||||||||||||||||||||||||||||||||||||||||||||||||||||||||||
| Other | 65 | |||||||||||||||||||||||||||||||||||||||||||||||||||||||||||||||||||||||||||||||||||||||||||||||||||||||||||||
2002 - 2018 National Fire Incident Reporting System (NFIRS) incidents
- Incident types reported to NFIRS in Edna, KS
- 30951.0%Fire
- 21335.1%Rescue & EMS
- 376.1%Hazardous Condition
- 172.8%Good Intent Call
- 122.0%Severe Weather
- 111.8%False Alarm
- 71.2%Service Call
- Fire incident types reported to NFIRS in Edna, KS
- 19563.1%Outside Fires
- 7624.6%Structure Fires
- 247.8%Mobile Property/Vehicle Fires
- 144.5%Other
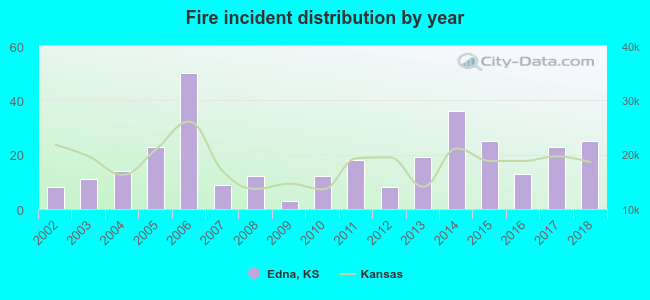 Based on the data from the years 2002 - 2018 the average number of fires per year is 18. The highest number of fires - 50 took place in 2006, and the least - 3 in 2009. The data has a rising trend.
 27.8% incidents where reported in the morning and 72.2% in the evening. The most fires (19.7%) took place on Saturday, and the least (11.3%) on Wednesday.
 According to the 309 fire incidents from years 2002 - 2018 most fires (22.0%) took place during March, and the least (2.3%) in May.
 Out of all 606 cases reported during the years 2002 - 2018, the most belonged to the categories: Fire (51.0%), Overpressure Rupture (35.1%), and Rescue & EMS (6.1%).
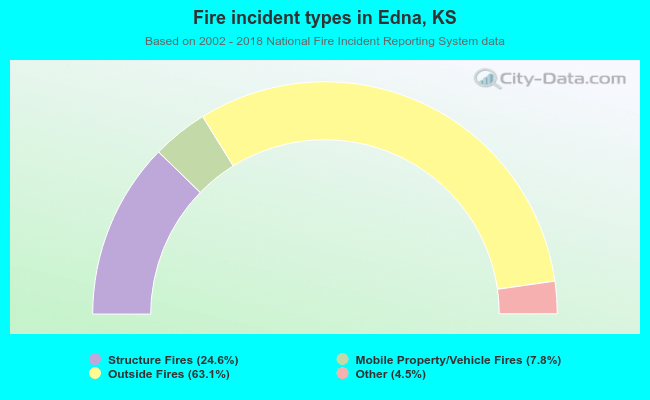 When looking into fire subcategories, the most reports belonged to: Outside Fires (63.1%), and Structure Fires (24.6%).