| Fire incidents reported |
|---|
| Sreet name | Count |
|---|
| CLAXTON AVE | 45 | | US 84 HWY | 45 | | HICKMAN AVE | 30 | | AL 166 HWY | 25 | | AL 203 BYP | 25 | | DAVIS ST | 25 | | COFFEE COUNTY 377 RD | 20 | | OLD CURTIS RD | 20 | | REESE AVE | 20 | | AL 125 HWY | 15 | | AL 189 HWY | 15 | | HWY 166 | 15 | | 932 CO RD 547 | 10 | | AL 87 HWY | 10 | | AL HIGHWAY 87 | 10 | | COFFEE CO 427 | 10 | | COFFEE COUNTY 239 RD | 10 | | COFFEE COUNTY ROAD 407 | 10 | | COUNTY ROAD 360 | 10 | | HERMAN DRIGGERS DR | 10 | | HWY 141 | 10 | | HWY 87 SOUTH | 10 | | INDUSTRIAL BLVD | 10 | | JACKSON ST | 10 | | LARKIN RD | 10 |
| | | Fire incidents reported |
|---|
| Sreet name | Count |
|---|
| LEE ST | 10 | | MARTIN LUTHER KING DR | 10 | | MORROW AVE | 10 | | MULLINS CIR | 10 | | OLD SAMSON HWY | 10 | | PINE COVE DR | 10 | | SIMMONS ST | 10 | | SMITH AVE | 10 | | TAYLOR MILL RD | 10 | | WILLIAMS ST | 10 | | COFFEE COUNTY ROAD 306 | 8 | | COFFEE COUNTY ROAD 363 | 8 | | 1123 PINE COVE DR | 5 | | 11754 HWY 87 | 5 | | 141 ELBA HWY | 5 | | 14602 HWY 87 | 5 | | 14887 HWY 84 WEST | 5 | | 15163 HWY 84 | 5 | | 24735 HWY 189 | 5 | | 25138 HWY 87 | 5 | | 256 COUNTY RD 349 | 5 | | 26332 HWY 189 | 5 | | 3410 OLD SAMSON RD | 5 | | 347 CO RD 355 | 5 | | 491 COUNTY RD 449 | 5 |
|
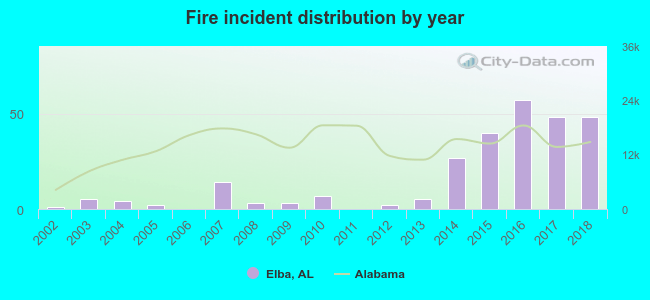 Based on the data from the years 2002 - 2018 the average number of fire incidents per year is 16. The highest number of reported fires - 57 took place in 2016, and the least - 0 in 2006. The data has a growing trend.
 31.2% incidents where reported in the morning and 68.8% in the evening. The most fires (18.4%) took place on Wednesday, and the least (11.7%) on Thursday.
 Based on the 266 fire incident reports from years 2002 - 2018 most fires (12.4%) took place during May, and the least (3.0%) in April.
 Out of all 722 cases reported during the years 2002 - 2018, the most belonged to the categories: Fire (36.8%), Rescue & EMS (35.5%), and Hazardous Condition (10.0%).
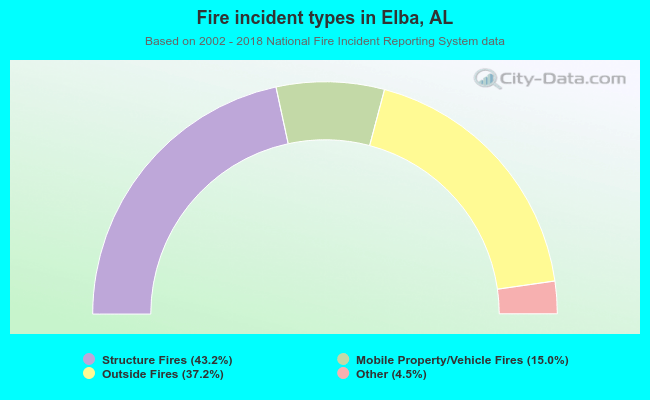 When looking into fire subcategories, the most reports belonged to: Structure Fires (43.2%), and Outside Fires (37.2%).