| Fire incidents reported |
|---|
| Sreet name | Count |
|---|
| NORTH BYRON RD | 20 | | OAK ORCHARD RD | 18 | | SNYDER RD | 18 | | S MAIN ST | 16 | | BRIDGE RD | 14 | | EDGERTON RD | 14 | | HUNDREDMARK RD | 14 | | WATSON RD | 14 | | NORTON RD | 12 | | BATAVIA-ELBA TOWNLINE RD | 10 | | LOCKPORT RD | 10 | | MAIN ST | 10 | | FORD RD | 8 | | NORTH BYRON RD | 8 | | OAK ORCHARD RD | 8 | | RT 98 | 8 | | RIDGE RD | 6 | | BARRVILLE RD | 4 | | BATAVIA ELBA TOWNLINE RD | 4 | | BYRON RD | 4 | | CHURCH ST | 4 | | HUNDREDMARK RD | 4 | | OAK ORCHARD | 4 | | RT 262 | 4 | | SOUTH MAIN ST | 4 |
| | | Fire incidents reported |
|---|
| Sreet name | Count |
|---|
| STAROWITZ RD | 4 | | WEATHERWAX RD | 4 | | 5520 N BYRON RD | 2 | | BATAVIA ELBA TOWNLINE | 2 | | BATAVIA ELBA TOWNLINE ST | 2 | | BERGEN RD | 2 | | BRIDGE RD | 2 | | CHAPEL ST | 2 | | CHURCH | 2 | | CHURCH ST | 2 | | DRAKE STREET RD | 2 | | HUNDERD MARK RD | 2 | | HUNDERMARK RD | 2 | | HUNDRED MARK RD. | 2 | | MAIN | 2 | | MALTBY RD | 2 | | MUCK RD | 2 | | NORTON RD | 2 | | OAK OCHARD RD. | 2 | | OAK ORCHARD HWY | 2 | | QUAKER HILL RD | 2 | | RIDGE RD | 2 | | ROUTE 98 | 2 | | S MAIN ST | 2 | | |
|
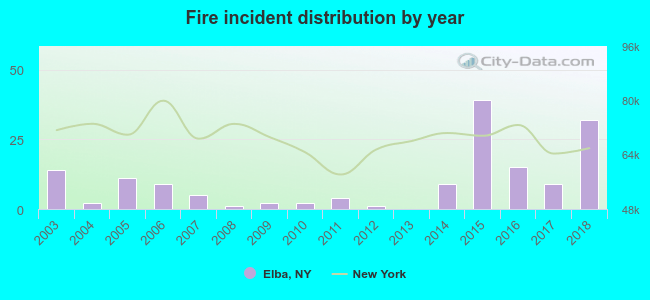 Based on the data from the years 2003 - 2018 the average number of fire incidents per year is 10. The highest number of fires - 39 took place in 2015, and the least - 0 in 2013. The data has a growing trend.
 47.7% incidents where reported in the morning and 52.3% in the evening. The most fires (20.0%) took place on Sunday, and the least (9.0%) on Friday.
 According to the 155 fire incident reports from years 2003 - 2018 most fires (18.7%) took place during July, and the least (0.0%) in February.
 Out of all 932 cases reported during the years 2003 - 2018, the most belonged to the categories: Overpressure Rupture (57.3%), Fire (16.6%), and Rescue & EMS (11.6%).
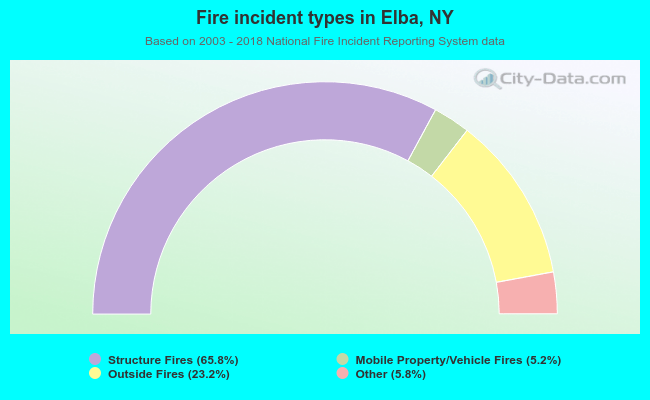 When looking into fire subcategories, the most incidents belonged to: Structure Fires (65.8%), and Outside Fires (23.2%).