Eldora: Fire Incidents, Iowa (IA)
Where are fire incidents reported in Eldora, IA
Something went wrong! Please refresh the page.
|
| |||||||||||||||||||||||||||||||||||||||||||||||||||||||||||||||||||||||||||||||||||||||||||||||||||||||||||||
2006 - 2018 National Fire Incident Reporting System (NFIRS) incidents
- Incident types reported to NFIRS in Eldora, IA
- 15261.8%Fire
- 239.3%Good Intent Call
- 208.1%Rescue & EMS
- 156.1%False Alarm
- 156.1%Severe Weather
- 114.5%Hazardous Condition
- 72.8%Special Incident
- 31.2%Service Call
- Fire incident types reported to NFIRS in Eldora, IA
- 5334.9%Outside Fires
- 4630.3%Structure Fires
- 2919.1%Other
- 2415.8%Mobile Property/Vehicle Fires
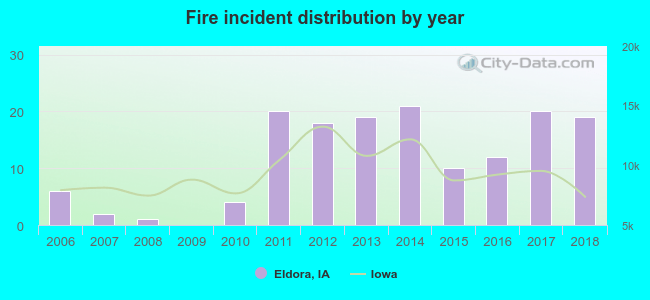 According to the data from the years 2006 - 2018 the average number of fires per year is 12. The highest number of fires - 21 took place in 2014, and the least - 0 in 2009. The data has a growing trend.
 32.2% incidents where reported in the morning and 67.8% in the evening. The most fires (17.8%) took place on Saturday, and the least (11.2%) on Wednesday.
 According to the 152 fire incident reports from years 2006 - 2018 most fires (20.4%) took place during April, and the least (3.3%) in September.
 Out of all 246 cases reported during the years 2006 - 2018, the most belonged to the categories: Fire (61.8%), Service Call (9.3%), and Overpressure Rupture (8.1%).
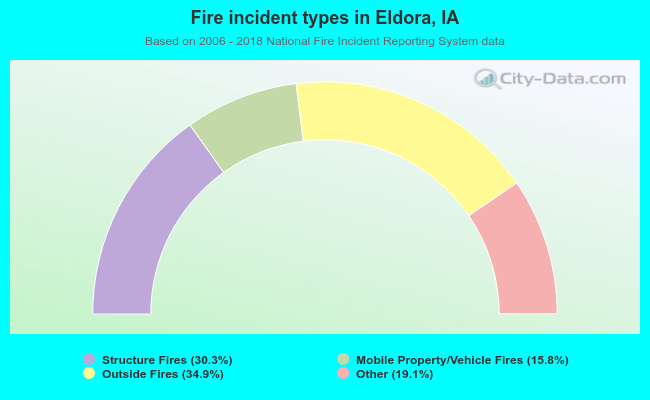 When looking into fire subcategories, the most reports belonged to: Outside Fires (34.9%), and Structure Fires (30.3%).