Eldridge: Fire Incidents, Iowa (IA)
Where are fire incidents reported in Eldridge, IA
Something went wrong! Please refresh the page.
|
| |||||||||||||||||||||||||||||||||||||||||||||||||||||||||||||||||||||||||||||||||||||||||||||||||||||||||||||
2003 - 2017 National Fire Incident Reporting System (NFIRS) incidents
- Incident types reported to NFIRS in Eldridge, IA
- 25830.4%Fire
- 18421.7%Hazardous Condition
- 17620.8%Rescue & EMS
- 12915.2%Good Intent Call
- 677.9%False Alarm
- 263.1%Service Call
- 40.5%Severe Weather
- 40.5%Special Incident
- Fire incident types reported to NFIRS in Eldridge, IA
- 10339.9%Outside Fires
- 10038.8%Structure Fires
- 3212.4%Mobile Property/Vehicle Fires
- 238.9%Other
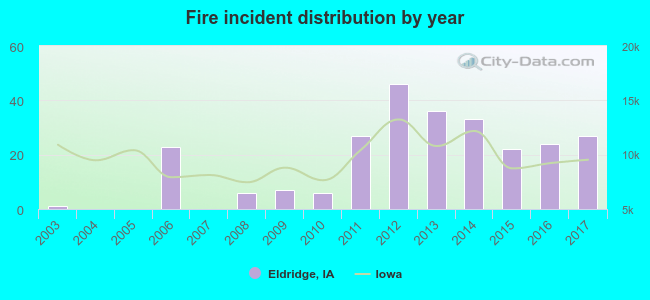 According to the data from the years 2003 - 2017 the average number of fires per year is 17. The highest number of fires - 46 took place in 2012, and the least - 0 in 2004. The data has a growing trend.
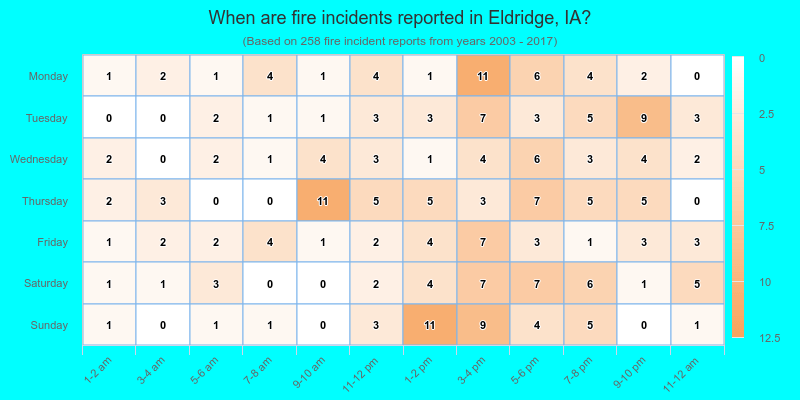
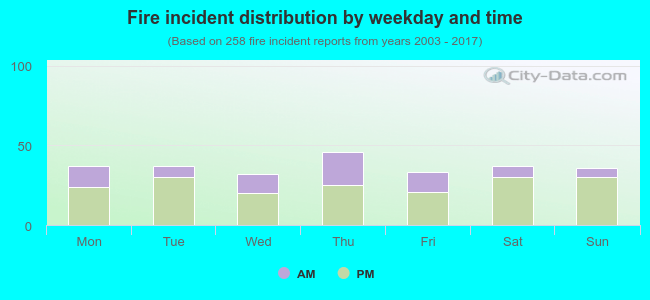 30.2% incidents where reported in the morning and 69.8% in the evening. The most fires (17.8%) took place on Thursday, and the least (12.4%) on Wednesday.
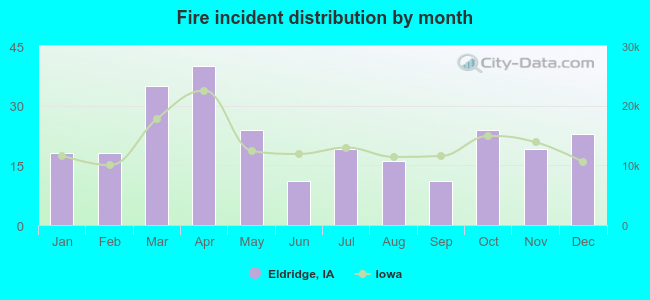 According to the 258 fire incident reports from years 2003 - 2017 most fires (15.5%) took place during April, and the least (4.3%) in June.
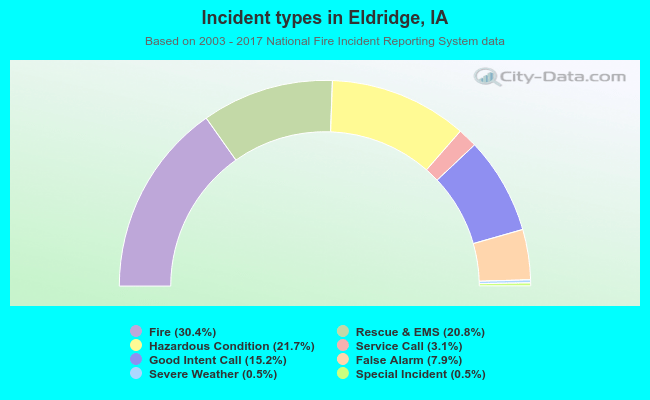 Out of all 848 cases reported during the years 2003 - 2017, the most belonged to the categories: Fire (30.4%), Rescue & EMS (21.7%), and Overpressure Rupture (20.8%).
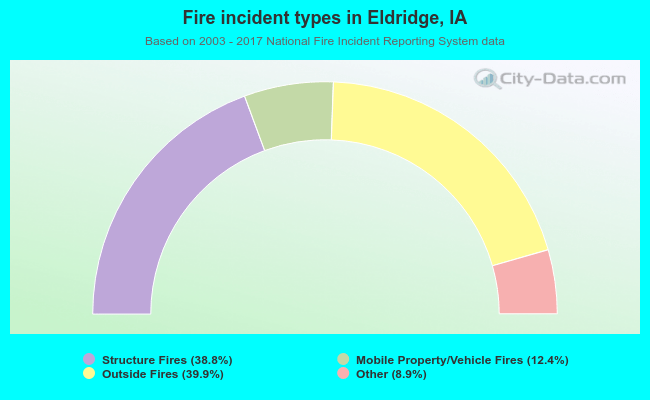 When looking into fire subcategories, the most reports belonged to: Outside Fires (39.9%), and Structure Fires (38.8%).