| Fire incidents reported |
|---|
| Sreet name | Count |
|---|
| HWY 49 | 12 | | HWY 21 | 10 | | 2ND AVE | 4 | | 56TH ST | 4 | | 70TH AVE | 4 | | 70TH AVE SW | 4 | | 74TH ST | 4 | | AVE | 4 | | HIGHWAY 49 | 4 | | 14 MILES SOUTH OF ELGIN | 2 | | 304 2ND AVE NE ELGIN | 2 | | 304 4TH AVE NW | 2 | | 305 WEST STREET NORTH | 2 | | 3RD AVE | 2 | | 500 IDAHO ST NW | 2 | | 56TH ST SW | 2 | | 58TH ST SW 71ST AVE SW | 2 | | 59TH AVE SW | 2 | | 61ST AVE | 2 | | 62ND AVE SW | 2 | | 62ND ST | 2 | | 63 ST | 2 | | 63RD ST | 2 | | 64TH ST SW | 2 | | 66TH 67TH | 2 |
| | | Fire incidents reported |
|---|
| Sreet name | Count |
|---|
| 66TH ST | 2 | | 67 AVE | 2 | | 67TH AVE SW | 2 | | 68TH AT SW | 2 | | 68TH AVE | 2 | | 68TH ST | 2 | | 68TH ST SW | 2 | | 6964 HWY 21 | 2 | | 6975 ST 58TH | 2 | | 69TH AVE | 2 | | 69TH ST | 2 | | 7050 86RD ST SW | 2 | | 73RD ST | 2 | | 806 FRONTAGE RD | 2 | | 83RD ST | 2 | | DAKOTA ST | 2 | | HIGHWAY 21 | 2 | | HWY 49 NORTH | 2 | | LAKE TSCHIDA LOT 9 | 2 | | MONTANA ST | 2 | | NORTH HWY 49 | 2 | | NORTH HWY 49 4 MILES | 2 | | NORTH HWY 49 THEN EAST | 2 | | SCHATZ POINT | 2 | | |
|
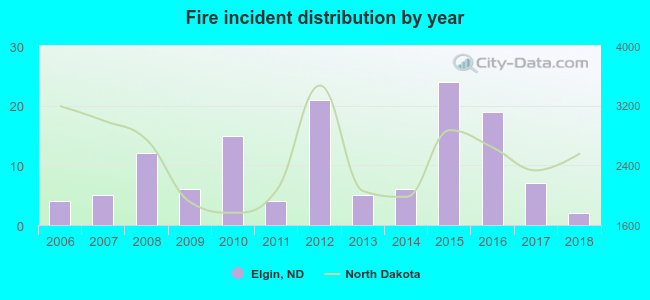 Based on the data from the years 2006 - 2018 the average number of fires per year is 10. The highest number of reported fires - 24 took place in 2015, and the least - 2 in 2018. The data has a declining trend.
 27.7% incidents where reported in the morning and 72.3% in the evening. The most fires (16.9%) took place on Monday, and the least (10.0%) on Friday.
 According to the 130 fire incidents from years 2006 - 2018 most fires (21.5%) took place during July, and the least (0.8%) in February.
 Out of all 146 cases reported during the years 2006 - 2018, the most belonged to the categories: Fire (89.0%), Overpressure Rupture (6.8%), and Service Call (2.7%).
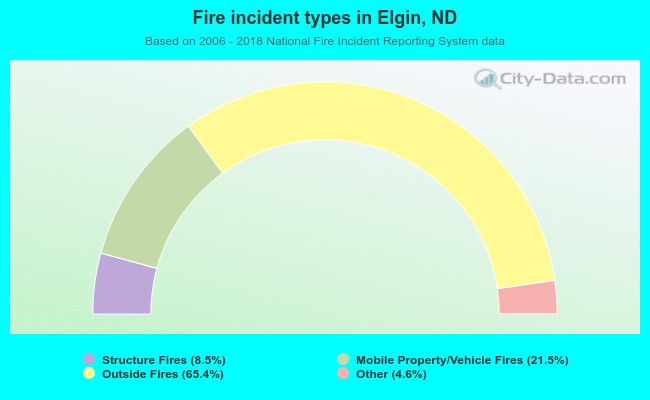 When looking into fire subcategories, the most reports belonged to: Outside Fires (65.4%), and Mobile Property/Vehicle Fires (21.5%).