Ellinwood: Fire Incidents, Kansas (KS)
Where are fire incidents reported in Ellinwood, KS
Something went wrong! Please refresh the page.
|
| |||||||||||||||||||||||||||||||||||||||||||||||||||||||||||||||||||||||||||||||||||||||||||||||||||||||||||||
2002 - 2018 National Fire Incident Reporting System (NFIRS) incidents
- Incident types reported to NFIRS in Ellinwood, KS
- 27663.9%Fire
- 5512.7%Hazardous Condition
- 4911.3%Good Intent Call
- 255.8%Service Call
- 133.0%Rescue & EMS
- 122.8%False Alarm
- 20.5%Overpressure Rupture
- Fire incident types reported to NFIRS in Ellinwood, KS
- 17864.5%Outside Fires
- 6322.8%Structure Fires
- 248.7%Mobile Property/Vehicle Fires
- 114.0%Other
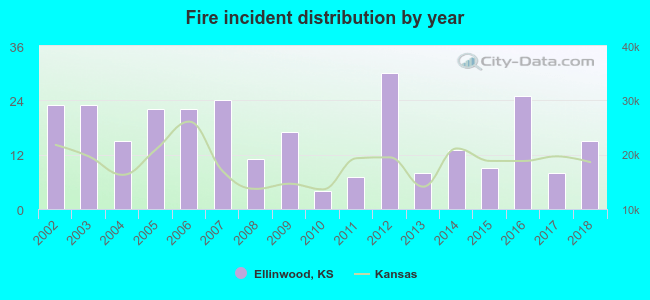 Based on the data from the years 2002 - 2018 the average number of fire incidents per year is 16. The highest number of fires - 30 took place in 2012, and the least - 4 in 2010. The data has a dropping trend.
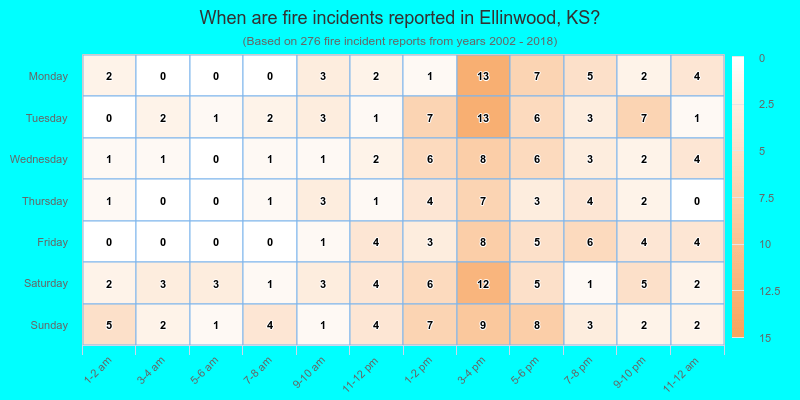
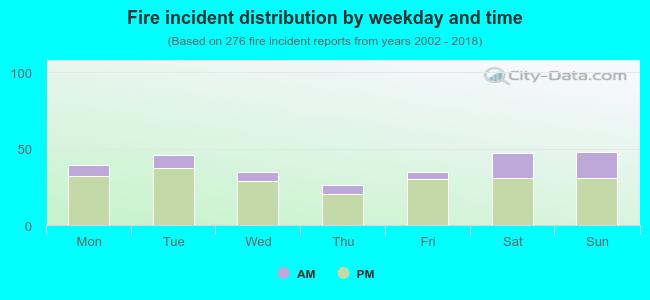 23.9% incidents where reported in the morning and 76.1% in the evening. The most fires (17.4%) took place on Sunday, and the least (9.4%) on Thursday.
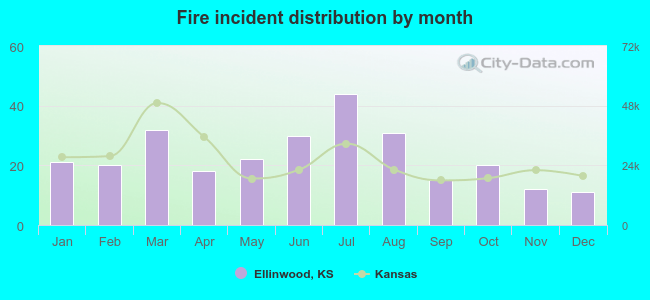 According to the 276 fire incidents from years 2002 - 2018 most fires (15.9%) took place during July, and the least (4.0%) in December.
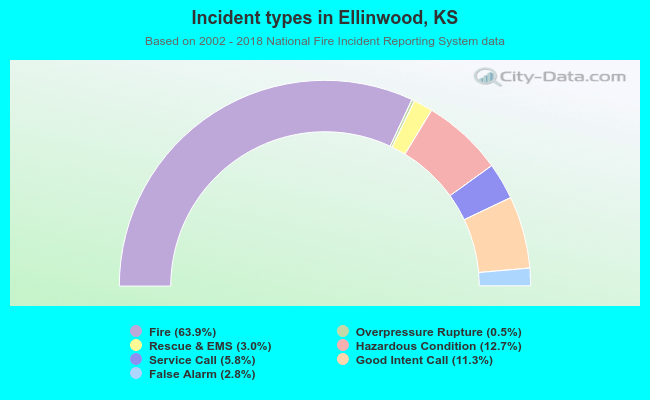 Out of all 432 cases reported during the years 2002 - 2018, the most belonged to the categories: Fire (63.9%), Hazardous Condition (12.7%), and Good Intent Call (11.3%).
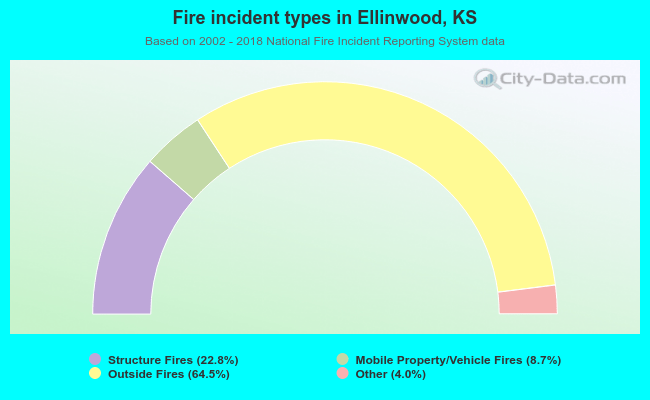 When looking into fire subcategories, the most incidents belonged to: Outside Fires (64.5%), and Structure Fires (22.8%).