Ellwood City: Fire Incidents, Pennsylvania (PA)
Where are fire incidents reported in Ellwood City, PA
Something went wrong! Please refresh the page.
|
| |||||||||||||||||||||||||||||||||||||||||||||||||||||||||||||||||||||||||||||||||||||||||||||||||||||||||||||
2004 - 2018 National Fire Incident Reporting System (NFIRS) incidents
- Incident types reported to NFIRS in Ellwood City, PA
- 41738.9%Fire
- 26224.4%Hazardous Condition
- 14313.3%Rescue & EMS
- 1019.4%Service Call
- 999.2%Good Intent Call
- 434.0%False Alarm
- 40.4%Special Incident
- 30.3%Severe Weather
- Fire incident types reported to NFIRS in Ellwood City, PA
- 26764.0%Structure Fires
- 9322.3%Outside Fires
- 5212.5%Mobile Property/Vehicle Fires
- 51.2%Other
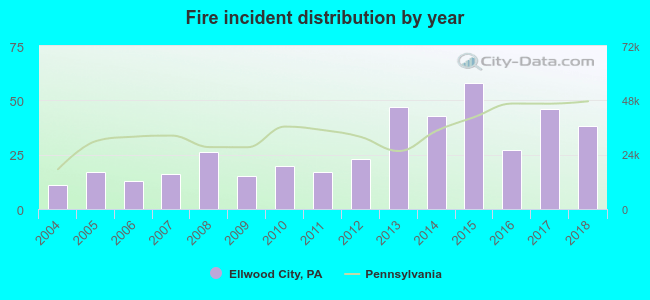 According to the data from the years 2004 - 2018 the average number of fire incidents per year is 28. The highest number of fires - 58 took place in 2015, and the least - 11 in 2004. The data has a rising trend.
The average number of yearly fire incidents per 10k residents in Ellwood City, PA compared to nearest cities:
(Note: Based on data for the last 3 years, including only cities with population 5,000 and above)
| Ellwood City: | 48.2 |
| Beaver Falls: | 119.0 |
| New Brighton: | 100.9 |
| New Castle: | 47.7 |
| Monaca: | 45.8 |
| Economy: | 2.2 |
| Aliquippa: | 102.0 |
| Ambridge: | 60.4 |
| Butler: | 113.2 |
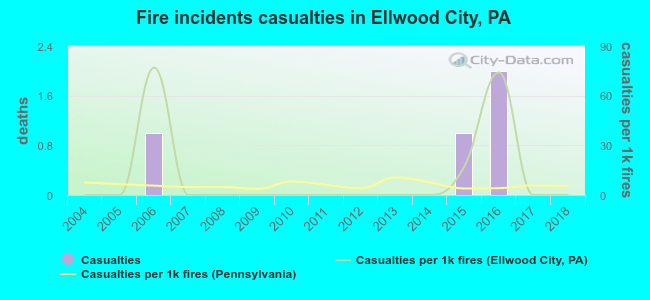 Based on the reports from the years 2004 - 2018 the average number of fire-related yearly casualties is 0. The highest number of reported casualties - 2 took place in 2016, and the lowest - 0 in 2004. The data has a constant trend.
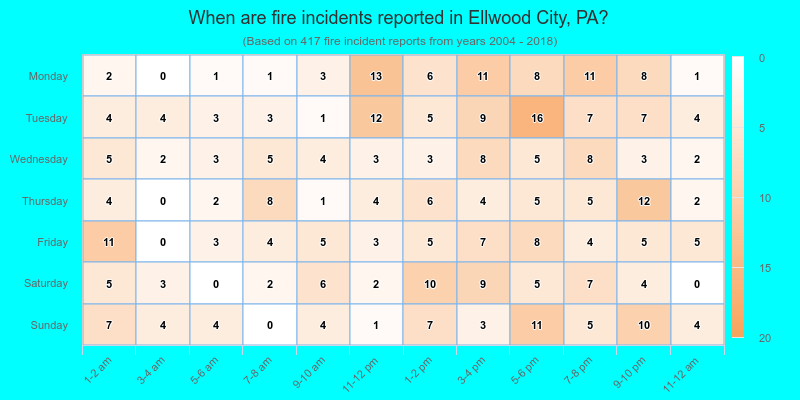
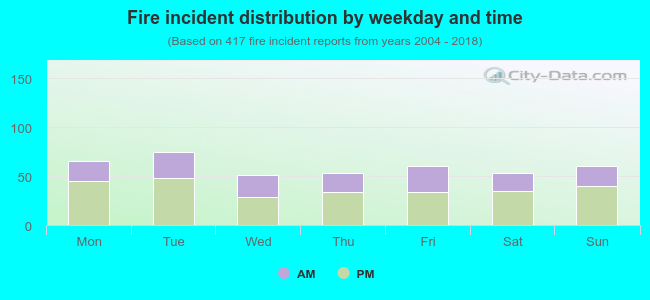 36.5% incidents where reported in the morning and 63.5% in the evening. The most fires (18.0%) took place on Tuesday, and the least (12.2%) on Wednesday.
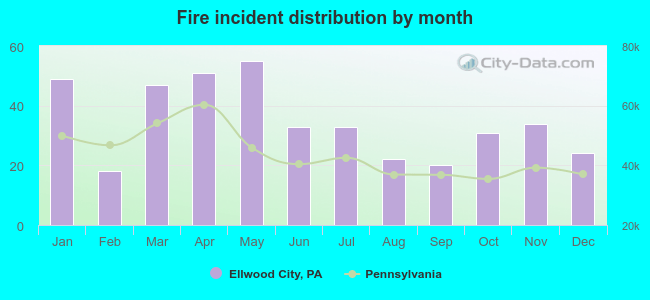 According to the 417 fires from years 2004 - 2018 most fires (13.2%) took place during May, and the least (4.3%) in February.
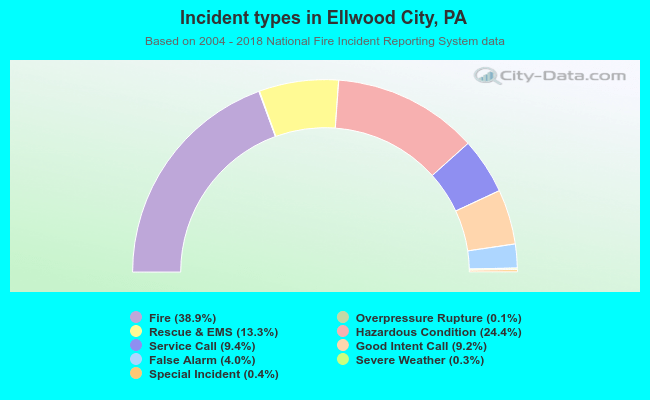 Out of all 1,073 cases reported during the years 2004 - 2018, the most belonged to the categories: Fire (38.9%), Hazardous Condition (24.4%), and Rescue & EMS (13.3%).
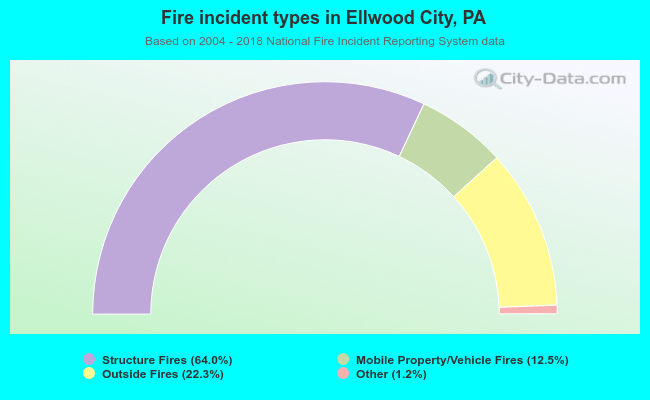 When looking into fire subcategories, the most incidents belonged to: Structure Fires (64.0%), and Outside Fires (22.3%).